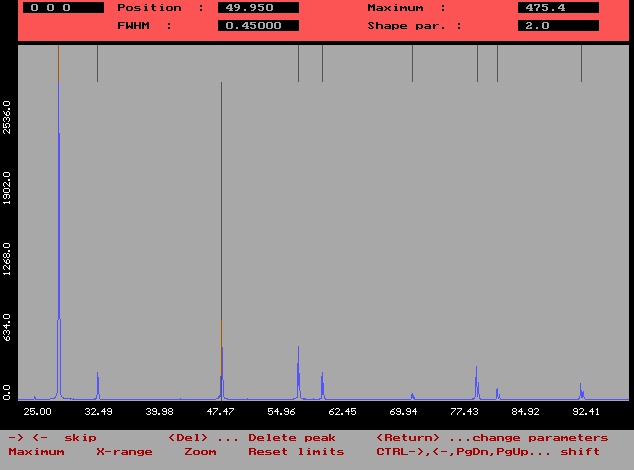
The parameters of individual peaks within the current limits can be found and changed either in the Main menu (submenu Output, Show parameters) or in Graphics (submenu Parameters, Peaks).
Profile parameters of all peaks of the current pattern are shown and can be modified either for all peaks simultaneously or peak-by-peak in Peaks.
Total pattern calculated from the profile parameters using the Pearson function can be shown by View Pearson. The default value of the Pearson function exponent is 2.
The following procedures are applied to the parameters of all peaks of the current file (for plotting pattern only).
Shift pattern - shift of
pattern by given value
Multiply pattern - increase or decrease of peak
heights
Tail changes - multiplication of the exponents
by a given value
FWHM change - multiplication of halfwidths by a
given value
Replace pattern - replaces the current pattern
with the calculated one (changes original data). This could be
useful for pattern combination.
Peaks
Peak-by-peak change or simple view of the Profile parameters.
The GPS (graphic peak selection) is automatically introduced and after the selection of a peak the profile parameters can be modified. The basic profile parameters are displayed in the top window.
There are two ways how to modify the parameters - numerical and graphical. The former consists in explicitly given number after the selection of approapriate parameter (in bottom window). In the latter case, the parameter is only pointed by the direction key without selection, instead of which the GCS mode (graphic cursor) is introduced by pressing <TAB>.
The following items are connected to the current peak selected by GPS. Only the first two parameters can be changed graphically.
Maximum - change of maximum
Position - change of position
FWHM - change of halfwidth
Shape parameter - change of exponent of the
Pearson function
HKL - "indexing" (labeling with
indices) routine is invoked
Intensity
Integrated intensity and integral breadth of the current
reflection (selected) as well as the centroid are calculated and
shown. The calculation is performed very simply from the left
side of peak (or groups of peaks), where the intensity is zero to
right point with the same condition. There is no peak separation.
The area of the peak used for the calculation is filled with
different colour. If the result is not satisfactory then the
theta limits can be changed graphically (GCS, press N for this).
Set the left limit first.

Submenu Show parameters of the menu Output.
Current values of XRD line profile parameters for the peaks of the current phase in current file (pattern) lying within the current limits are shown in a table. The item also allows the change of all profile parameters (find the parameter to be changed by direction keys and press <Enter>, then give a new value). Only the basic profile parameters are shown, for more information see Output.
