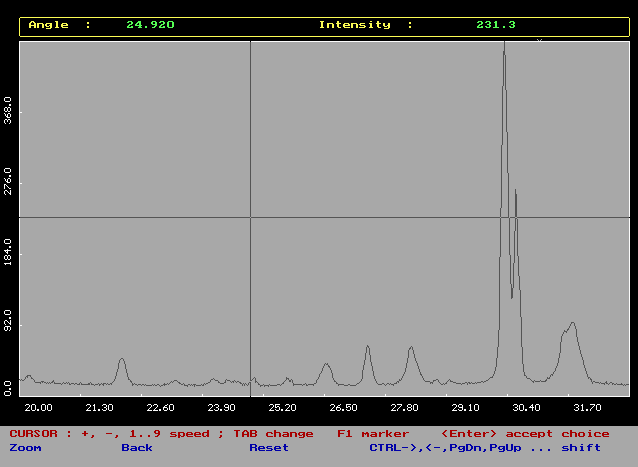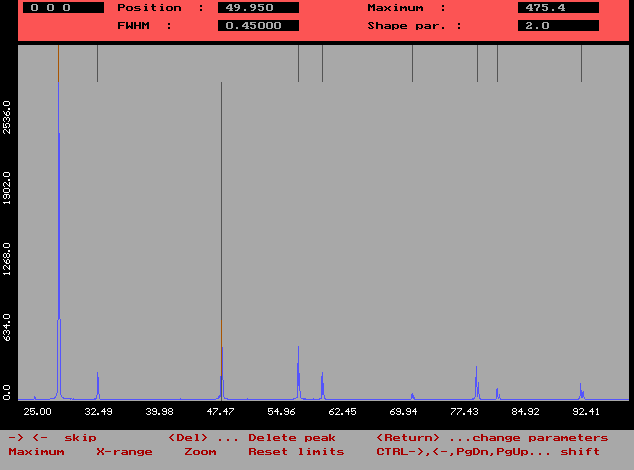

Graphic cursor is introduced from the Main graphic menu by pressing <TAB>. In some procedures it is introduced automatically for graphic input.
There are two types of graphic cursor : x-y cross (default) and independent X and Y lines. By pressing <TAB> in GCS mode it is possible to switch from one to another. They are moved by the direction keys.
<Enter> ... accept the position of the graphic cursor (for graphical input)
<ESC> ... quit from GCS
In the top window the current values of angles and intensities are shown.
Cursor motion :
velocity - numbers 1-9 (1 default) determines the step in data points (9 is the fastest motion),
+ ........ speed up 4x
- ........ slow down 4x
<Home> - cursor to the left
<End> - cursor to the right
<PgUp> - cursor to the top
<PgDn> - cursor to the bottom
<F1> menu for the change of marker for the current file
Size and shifts of the graph :
<Z> (Zoom) - enlargement of the graph around the current position of the cursor
The movable box appears on the screen. Shift it by cursor keys.
<Ctrl <- > locks the lower left corner
<Ctrl -> > unlocks the lower left corner
If you try to shift the box outside of any border, its size is decreased in corresponding direction.
<R> (Reset) - reset limits (see 43 Reset
limits )
<CTRL -> > - shift of the graphic window on the
diffraction pattern to right (new limits : Left = Right[old],
Right = Left + (Right[old] - Left[old]))
<CTRL <- > - shift of the graphic window to the left
<CTRL PgUp> - - " - upwards - " -
<CTRL PgDn> - - " - downwards - " -
Graphics peak selection (GPS) mode

The procedure is similar to GCS with the following exceptions. There is only vertical line cursor moving by left and right direction keys from one peak to another with a constant velocity. The peaks should be found before the switching to the mode.
Each peak can be deleted from the set by pressing <Del> key.
For the current peak the basic Profile parameters are shown in the top window : peak height, position, halfwidth and exponent of the Pearson function.