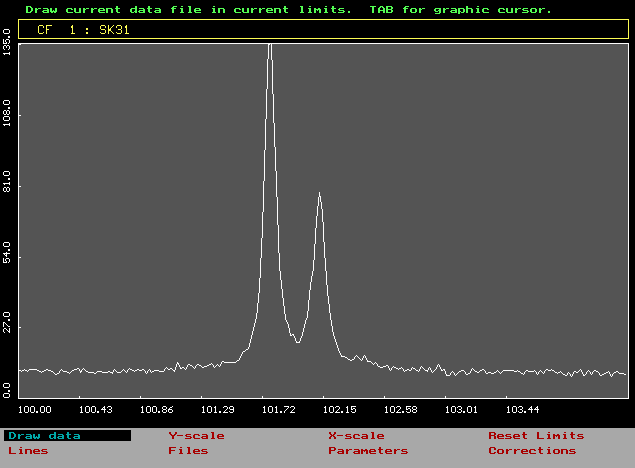
Graphical screen is divided into several windows. The files with the status of ACTIVE set to 'true' are shown in current limits and in corresponding colors.
Diffraction pattern (experimental or calculated) can contain about 1000-10000 points in maximum depending on Version and memory available. In Graphics diffraction peaks can be found or defined. Up to 60 peaks are allowed. They can be indexed and also prescribed to different Phases (up to 10), which are distinguished by numbers. Names can also be given to them by Phases in the Main menu.
The angle and intensity limits given in Graphics are the current limits for all operations of program (e.g. fitting). There are several windows in graphical mode:
Central graphic window ......
Plot of the data
Bottom text window ...... Menu
Top text window ...... Help line (in most
cases), A short help for the current menu item in the bottom
window. It shows the help for either the operation or submenu
selected. Information and/or input line.
2nd top text window ...... Information line (e.g.current file)
3rd top window ...... Display of peak parameters
Main menu consists of the following items:
Draw
Y-scale
X-scale
Reset limits
Lines
Files
Parameters
Corrections
In the menu short-cut keys can be used for change of colors, labels, markers, X-scale etc .
Everywhere the <Enter> is used for selection and <ESC> for change to top submenu. The items can also be selected by the first letter. This is the fastest way of work (e.g. by double pressed L you can introduced reflection labels).
TAB is used for the introduction of graphic cursor.
The change of scale can be done directly from the main menu or in Graphic cursor mode.
Y-scale: Change of maximum for the plotting of diffraction patterns.
GCS - graphical selection of maximum
Increase - increase of maximum by factor 2
Decrease - decrease - " -
Reset limits - maximum is set to its original
value for the Current file
(see File parameters).
Ticks - after selection number of Y-axis ticks
is given
Maximum - numerical input of new maximum
Change to log - change to logarithmic scale
(toggle)
Sqrt scale - change to square root scale
(toggle)
Plot type - marker (solid line) selection
Y-grid - Y axis grid (toggle)
X-scale: Change of minimum and maximum of 2 theta values for the plotting of diffraction patterns.
GCS - graphical selection of maximum
Increase - range is enlarged by a definite
factor
Decrease - range is decreased
Ticks - after selection number of Y-axis ticks
is given
Limits - numerical input of left and right
limits
Scale(d-2theta) - d (interplanar spacing - 2
theta toggle
Reset limits - limits are initiated to their
original X values for the Current file
(see File parameters)
X-grid - X axis grid (toggle)
Reset limits
X and Y limits for the plotting of
diffraction patterns are initiated to their original values. The
values are shown and can be changed in File parameters.
If you change starting value there, the pattern is shifted by the same value!
The data can be graphically corrected in submenu Data correction of the menu Corrections.
Shortcut keys for Main graphic menu
Draw -
Plots all the files having status set to ACTIVE (see File parameters) in current X and Y limits. These are initiated after the loading of files to the minimal and maximal values and can be changed. If the variable PlotFitCurve (Fitting parameters) is set ON (automatically after the fitting) then also the calculated pattern is shown. If the variable PlotPeaks1 (PlotPeaks2) is set ON then also the individual fitted alpha1 peaks (doublets) are shown. If the variable PlotResidua is set ON then also the differences between experimental and calculated pattern are shown in the middle of main graphic window. (see also Shortcut keys ).
By selecting the item Draw the figure containing unnecessary information can always be cleared and redrawn