The peaks can be searched or defined in submenu Labels.
Peaks of the Current file can be either found or given manually by Peak set (indices and positions). If they have been found, the individual reflections can be removed from the set by Erase peak and other peaks may be added to the set by Add peak.
Markers
of peaks are switched on/off by the toggle. Short lines
in the top of main window are shown.
Labels
of peaks can be shown by selection of the item. They are shown
vertically in peak positions.
Both peak markers and labels are also drawn by plotter and they can be introduced by ALT M and ALT L, respectively (see Shortcut keys), from the Main graphic menu. Only markers and labels of the Current phase are shown.
Search peak submenu
There are 2 methods implemented for the search of peaks. Widths and heights of peaks are also calculated.
The default procedure includes the well-known Savitzky-Golay smoothing and derivative algorithm. It can give shifted maxima sometimes depending on smoothing rate. Numerical derivations of the pattern are used for the determination of basic profile parameters. The second procedure is simpler but it can lead to some troubles if there is a large noice and does not separate strongly overlapped peaks. It uses fast fit of the Gaussian curve to the peak maximum for the precise determination of peak position and halfwidth. For its application the threshold level must be set not to low and smoothing procedure can be used.
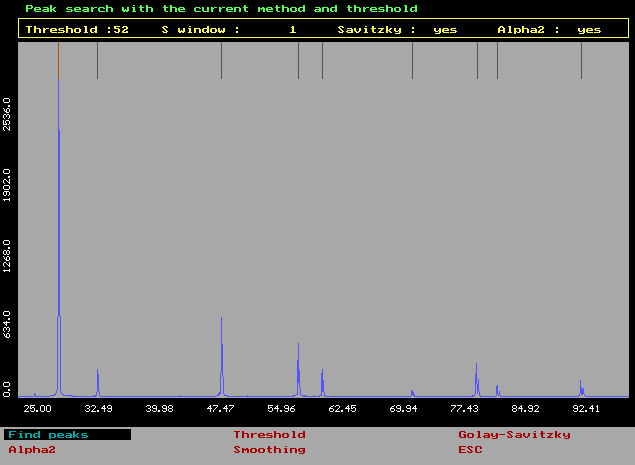
There are two toggles the state of which is shown in information line (2nd from the top) :
Golay-Savitzky -
ON the Savitzky-Golay alorithm is used
OFF simpler procedure with Gaussian fitting of the peak maxima is
used
Alpha 2 -
ON continuous search is carried out
OFF after the determination of peak position the interval
corresponding to the distance of a peak is skipped over.
Treshold level -
only the data lying above the level are searched for maxima
(useful for the supression of noice effects). A dotted line shows
the current value of the threshold. It can be shifted by graphic
cursor after the item selection.
Smoothing -
linear data smoothing for the peak search only (not necessary for
the Savitzky-Golay method). Smoothing window (number of points)
must be given in the top input line.
Peak search is started by selection of Find peaks.
The Savitzky-Golay algorithm gives usually more peaks. This depends on characteristic line width which must be given in the top input line before the search.
Modification of the peak set in current pattern.
The peak can be removed by Erase
peak (Labels submenu).
The GPS
mode is introduced and a
line in place of the current peak is shown. The peak is deleted
from the set by <Del>. Change peaks by direction keys. In
the top window corresponding profile parameters are shown.
A peak can be added to the peak set of the
Current file by Add peak (Labels submenu).
Peak position is selected by Graphic cursor. The Graphic cursor
mode is introduced automatically. After the selection by
<Enter> the question 'Gauss fit ? ' appears. Say 'y' only
for isolated peaks otherwise the program can break down. For
'yes' a Gaussian curve is fitted to the top of the peak and
determines the basic profile parameters. Otherwise a peak
position and height are derived from cursor position.
By selecting the item several times the whole peak set can be created graphically and then indexed.
Indexing of peaks
Indices can be attached to the peaks of current pattern manually by selecting Indexing (Labels submenu). The input line in the top of the screen is shown asking for the indices of peaks (peak-by-peak) and also for the corresponding phase number (see Phases). Spaces between individual indices h k l must be inserted. Current (default) values are shown in brackets. By pressing <ESC> you do not change them. Simultaneously lines in peak positions are shown. All the operations are applied only to the current file within the current limits of the graph.
