LOCALISATION OF ACCUMULATED CHLOROPHYLL
CATION IN REACTION CENTRE OF PHOTOSYSTEM II
F. Vácha1,2, M. Kutý1,
M. Durchan1,2, P. Šiffel1,2 and J. Pšenčík1,3
1Institute of Physical Biology, University of
south Bohemia, Zámek 136, 373 33 Nové Hrady, Czech Republic
2Institute of Plant Molecular Biology, AS CR,
Branišovská 31, 370 05 České Budějovice, Czech Republic
3Faculty of Mathematics and Physics, Charles
University, Ke Karlovu 3, 120 00 Prague, Czech Republic
Introduction
Photosystem
II is a pigment-protein complex of thylakoid membrane of cyanobacteria, algae
and higher plants. It performs series of light driven reactions, which result
in a separation of charge and subsequently in a reduction of an
electron-transport chain and water oxidation. Primary site of the energy
conversion is located in a so-called reaction centre. In its simplest form the
reaction centre consists of a heterodimer of D1 and D2 proteins with two
subunits of cytochrome b559 α and β [1, 2]. Isolated RC binds 6
molecules of chlorophyll, 2 pheophytins, 1 or 2 molecules of β-carotene
and an atom of non-heme iron [3, 4]. In spite of a great effort there have been
little success resolving the atomic structure of PSII RC. Therefore, many of
the structural and functional data have been obtained by comparing the PSII RC
with very similar reaction centres of purple bacteria. It led to several
structural models, which are based on a homology between purple bacteria and
PSII RC [5, 6]. Recently, structure of the PSII complex isolated from
cyanobacteria Synechococcus elongatus has been presented at the
resolution of 3.8 Å [7]. Such resolution gives the idea of orientation of
proteins, position of most of the pigments and other cofactors and overall
shape of the system. However, the orientation of pigment dipoles is still
unknown.
In this report we have combined the structural model proposed by Svensson et al. [5] and the structure presented by Zouni et al. [7]. Using this model we have calculated the absorbance and circular dichroism spectra and compared them with the experimental results.
Materials and Methods
All
PSII RC were isolated from 14 days old pea plants (Pisum sativum). PSII
RCs containing 5 chlorophyll molecules per two pheophytins were isolated
according to Vacha et al. [8]. PSII RCs containing 6 molecules of chlorophyll
per two pheophytins were isolated from PSII core particles by short Triton
X-100 treatment [9] with slight modification. As a starting material we have
used PSII core particles isolated according to Ghanotakis et al. [10]. PSII
core particles were incubated with 1% Triton X-100 for 20 minutes in dark at 4 oC
and than separated on a Q Sepharose column. After washing the unbound material
from column with a washing buffer 50 mM MES, 0.02% DM, pH 6.5 the PSII RC were
eluted with a gradient of 0 - 200 mM MgSO4 in the washing buffer.
PSII RC was detected according to their characteristic absorbance spectra.
For all spectroscopic measurements samples were
diluted to the final concentration of ~ 10 mg Chl . ml-1 in a buffer containing
50 mM MES, 0.02% DM at pH 6.5. For low temperature spectra glycerol was added
to the sample to a final concentration of 65 % (v/v).
Absorbance spectra were measured on Unicam 500
spectrophotometer (Spectronic Unicam, Cambridge, UK), spectra of circular
dichroism were recorded using JASCO J-715 spectropolarimeter (JASCO
Corporation, Tokyo, Japan).
The light-induced oxidation of chlorophyll of
the RC primary donor was measured in the presence of silicomolybdate (SiMo) at a
concentration of 200 mM. The spectra of light-induced absorbance and circular dichroism
changes were recorded accordind to Vacha et al. [11].
Low temperature spectra were measured in an Oxford Optistat Bath cryostat (Oxford Instruments, Oxon, England), temperature in the cryostat was controlled by an Oxford Temperature Controller ITC 503 (Oxford Instruments, Oxon, England).
For the pigment modelling and alignment we have
used Swiss PDB Viewer program ver. 3.7 [12]. The files of structural data were
downloaded from the Protein Data Bank (http://www.rcsb.org/pdb/) in the .pdb
format.
Absorbance and CD spectra were calculated by dipole-dipole approximation [13].
Results and Discussion
In
this report we combine the experimental and theoretical approach in order to
study the properties and function of the PSII RC pigments. We compare the data
of absorbance and circular dichroism spectroscopy with those calculated on the
basis dipole-dipole interaction from a “combined” model. As the ground for our
calculations we have used the PSII RC model of Svensson et al. [5]. This model
is based on the analogy between purple bacteria and PSII reaction centres and
it was optimised to fit the experimental spectroscopic data. However, it lacks
the peripheral chlorophyll molecules (Chlz) since they are also not
presented in the purple bacteria RC. Using Swiss Pdb Viewer program [12] we
have aligned the position of the PSII RC pigments of the theoretical [5] model
(file ID - 1DOP) with the positions of pigments of the PSII RC from the
structural data (file ID - 1FE1) reported by Zouni et al. [7]. Combination of
these two structures gives us a new “combined” model. For such “combined” model
we have used the position and orientation of the core pigments from the 1DOP
model, however, supplemented with the position and orientation of the
peripheral chlorophylls from the structural data 1FE1. Even if in 1FE1 file the
resolution of the X-ray structural data is not sufficient to resolve the
orientation of the dipole moments of the pigments the pyrrol rings of the
chlorines are labelled according to IUPAC standard there and we have used this
labels to determine the orientation of the pigment dipoles. It must be stated,
however, that in the case of the peripheral chlorophyll molecules neither the
orientation nor the position further from the PSII RC, than it is in the 1FE1
structure, has an influence on the calculated absorbance or CD spectra.
Figure 1A shows the absorbance spectra of the
PSII RC containing 6 and 5 chlorophyll molecules together with the calculated
spectra. The calculated spectra represents the PSII RC based on the
"combined" model with all 6 chlorophyll molecules and with the PSII
RC where one of the peripheral chlorophyll is missing. The shape of the
calculated spectrum of the 5 chlorophyll PSII RC is independent on the position
(either Chlz - D1 or Chlz - D2) from which the peripheral
chlorophyll was disposed. The calculated spectrum for the 6 chlorophyll PSII RC
fits well the experimental data. It the case of 5 chlorophyll PSII RC the
calculated spectrum has less intensive shoulder at 670 nm compare the
experiment. In the case of the experimental data the 670 nm shoulder of the 5
chlorophyll PSII RC is about one third less intensive compare to the 6
chlorophyll PSII RC [14], in the case of the calculated data the 5 chlorophyll
PSII RC has the 670 nm shoulder about half intensive compare to the calculate 6
chlorophyll PSII RC.
Figure 1B shows the CD spectra of the 6
chlorophyll PSII RC compared with the calculated CD spectra of the
"combined" model. The calculated CD spectra of the
"combined" model are almost identical whether calculated with 6
chlorophyll or with the 5 chlorophyll PSII RC where any of the peripheral
chlorophyll Chlz depleted. The maximum of the positive peak in both
experimental and calculated CD spectra is at 681 nm, the minimum of the
negative peak is 664 nm for the experimental and 668 nm for the calculated
spectrum. The ratio of the amplitude of the positive to negative peak is for
the experimental data 6.95, for the calculated spectra 1.33.
Figure 2 shows the light induced absorbance
difference spectra of the PSII RC in the presence of artificial electron
acceptor SiMo measured at temperatures of 273 K and 77 K together with the
calculated absorbance difference spectra for the PSII RC where one particular
chlorophyll molecule is omitted from the calculation. The number of the omitted
chlorophyll is inscribed in the title of particular plot. The nomenclature of
chlorophylls in the PSII RC is as follows. Chl1 - accessory chlorophyll on the
D1; Chl2 - chlorophyll ligated to the His198 on D1; Chl3 - chlorophyll ligated
the teh His198 on D2; Chl4 - accessory chlorophyll on the D2; Chl5 - peripheral
chlorophyll Chlz on the D1; Chl6 - peripheral chlorophyll Chlz
on the D2. Figure 2A indicates that the experimental and calculated data are
most similar in the case when the Ch1 chlorophyll molecule is missing. This
would reflect the fact that chlorophyll cation is accumulated on the accessory
chlorophyll on D1 protein during the charge separation in presence of SiMo.
This is also supported by the comparison of the recorded and calculated difference CD spectra as it is represented at figure 3. Alike in the case of absorbance spectra the experimental CD spectrum matches the calculated one only in the case when the D1 accessory chlorophyll (Chl1) is omitted from the calculation.
This
work was supported by grants MSMT LN00A141, GACR 206/02/0942, GACR 206/02/D177.
1. Nanba, O. and Satoh, K. (1987) Proc. Natl.
Acad. Sci. U.S.A. 84, 109-112.
2. Barber, J., Chapman, D. J. and Telfer, A.
(1987) FEBS Lett. 220, 67-73.
3. Eijckelhoff, C. and Dekker, J. P. (1995)
Biochim. Biophys. Acta 1231, 21-28.
4. Zheleva, D., Hankamer, B. and Barber, J.
(1996) Biochemistry 35, 15074-15079.
5. Svensson, B., Etchebest,
C., Tuffery, P., van Kan, P., Smith, J. and Styring, S. (1996) Biochemistry 35,
14486-14502.
6. Xiong, J., Subramaniam, S. and Govindjee
(1998) Photosynth. Res. 56, 229-254.
7.
Zouni, A., Witt, H. T., Kern, J., Fromme, P., Krauss, N., Saenger, W. and Orth,
P. (2001) Nature 409, 739-743.
8. Vácha, F., Joseph, D. M., Durrant, J. R.,
Telfer, A., Klug, D. R., Porter, G. and Barber, J. (1995) Proc. Natl. Acad.
Sci. USA 92, 2929-2933.
9. Eijckelhoff, C., van Roon, H., Groot, M.‑L., van Grondelle, R. and Dekker, J. P. (1996) Biochemistry, 35, 12864-12872.
10. Ghanotakis, D. F., Demetriou, D. M. and
Yocum, C. F. (1987) Biochim. Biophys. Acta 891, 15-21.
11. Vácha Durchan Šiffel (2002) Biochim.
Biophys. Acta 1554, 147-152.
12. Gux, N. and Peitsch, M.C. (1997)
Electrophoresis 18, 2714-2723.
13. Pearlstein, R. M. (1991) In: Chlorophylls.
(ed. Scheer, H.) CRC Press, Bocca Raton, FL, USA. 1047-1077.
14.
Eijckelhoff, C., Vácha, F., van Grondelle, R., Dekker, J. P. and Barber, J.
(1997) Biochim. Biophys. Acta 1318, 266-274.
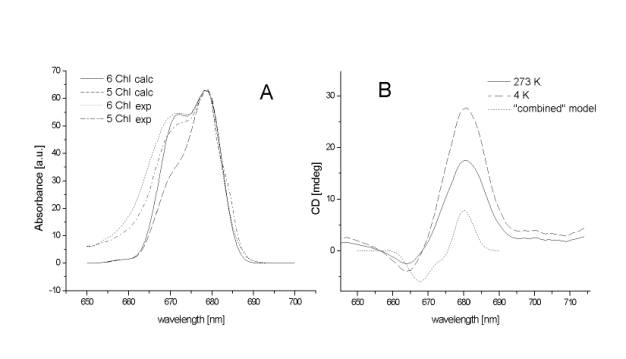
Figure
1
Comparison
of measured and calculated absorbance and circular dichroism spectra.
A –
absorbance spectra measured on 6 chlorophyll (dotted line) and 5 chlorophyll
(dash-dotted line) reaction centres compared with calculated spectra of 6
chlorophyll (solid line) and 5 chlorophyll (dashed line) reaction centres.
B –
circular dichroism spectra of 6 chlorophyll reaction centres measured at 273 K
(solid line) and 4 K (dashed line) compared with calculated spectra (dotted
line).
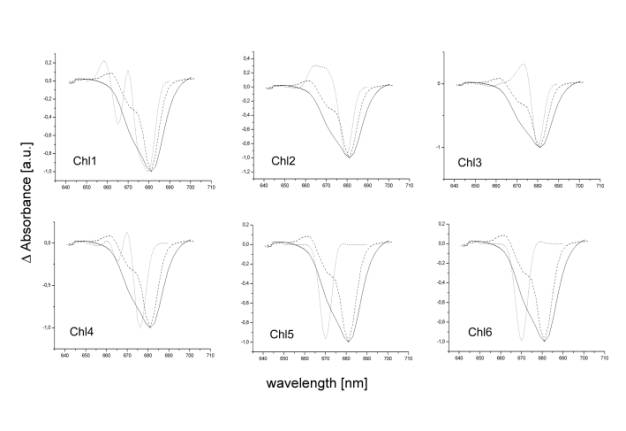
Figure
2
Light
induced (light minus dark) absorbance difference spectra of reaction centre of
photosystem II measured at 273 K (solid lines) and 77K (dashed lines)
compared with calculated absorbance difference spectra (dotted lines). The
calculated spectra were obtained by subtracting the original full pigment
spectra from spectra where one particular chlorophyll pigment (numbered in the
individual figures as Chl1-6) was omitted from the calculation.
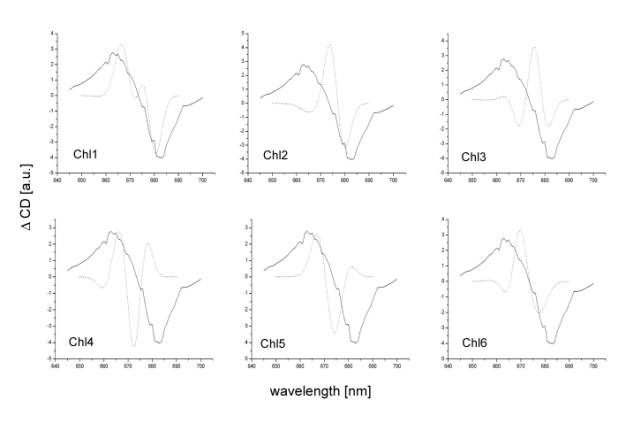
Figure
3
Light
induced (light minus dark) circular dichroism difference spectra of reaction
centre of photosystem II measured at 273 K (solid lines) compared with
calculated circular dichroism difference spectra (dotted lines). The calculated
spectra were obtained by subtracting the original full pigment spectra from
spectra where one particular chlorophyll pigment (numbered in the individual
figures as Chl1-6) was omitted from the calculation.