XRD structural
studies of strongly oriented hexaferrite thin films with potential
magnetoelectric effect prepared by chemical solution deposition
R. Kužel1,
J. Buršík2, M. Dopita1, L. Horák1, M. Soroka2
1Charles University, Faculty
of Mathematics and Physics – Prague, Czech Republic
2Institute of Inorganic Chemistry of the Czech Academy of Sciences -
Husinec-Rez, Czech Republic
Bulk hexaferrites are quite known to exhibit strong magnetoelectric (ME) effects near room temperature. However, in thin films the same effect have not often been realized. Our research has been concentrated on studies of different hexaferrite phases - M, Y, W, X, U and Z prepared by chemical solution deposition already for quite a long time. The phases are either hexagonal or trigonal and the crystal structure is typical by long unit cell and different stackings of basic building blocks. The ME effect was detected mainly in Y and Z films but other phases have been studied as well and in several cases they were prepared in a form of thin film for the first time [e.g. 1-4].
Chemical solution deposition method was applied, and several processing parameters were tested and optimized with the aim of minimizing the amount of impurities that could spoil the magnetic properties of the final material. For the preparation of highly oriented ferrite films, several substrates were used, and different substrate/seeding layer/ferrite layer architectures were proposed [1]. The preparation of strongly oriented films appeared to be complicated for some of the phases.
The ME Z-type ferrite Sr3Co2Fe24O41 and BaxSr3-xCo2Fe24O41 thin films with strong out-of-plane and in-plane orientation were prepared and characterized for the first time [2]. In the former case, the analysis was complicated by the presence of M and S (spinel) phases that were also oriented (aligned with the substrate and one with another). Consequently, many weak asymmetric reflections were overlapped and careful selection of reflections suitable for the analysis had to be made. The magnetization data show anomalies in the magnetic behaviour occurring at temperatures close to the room temperature that are characteristic for collinear to noncollinear spin structure transitions. It was found that the ME effect can be stronger for the oriented film, but still with some disorder, than for a single crystal [3]. This effect should be verified yet.
The mechanism of ME effect in Y-phases may be a little different and it seems to be influenced significantly by lattice parameters. New Y-ferrite phases were prepared with the composition BaxSr2-1Co2Fe11.1Al0.9O22, and it was found that the magnetic structure is of noncolinear ferrimagnetic type with an unspecified helical magnetic structure. These films could be prepared with good out-of-plane and in-plane orientation directly on STO - SrTiO3(111) substrate, but M-phase seeding layer usually leads to better results. ME effect was identified to be maximum for x = 1 but its dependence on x is studied in more details now. In the project, we are investigating the influence of the degree and type of preferred orientation of the films as well as their real structure on the ME effect. By using different substrates, different preferred orientations and strains can be obtained.
XRD studies
In addition to symmetric Bragg-Brentano scans showing often only strong basal 00l diffractions, a combination of different scans to characterize both out-of-plane orientation and in-plane orientations were applied. The lattice parameters, profile analysis (crystallite size and strains), and residual stresses were studied by combination of several asymmetric reflections scanned at specific suitable angles of inclinations and azimuths [4], i.e. partially as for a single crystal. Example is shown on Fig. 1. Out-of-plane preferred orientation can be quickly estimated by the so-called w-scans (rocking curves, rotation of sample at the fixed Bragg angle). Examples are shown on Fig. 2. In-plane orientation can be estimated by j-scans, rotation of sample on the axis perpendicular to the surface for asymmetric (inclined to the surface) diffractions. Strong distinct peaks indicate alignment of the planes perpendicular to the surface with the substrate. Examples are shown on Fig. 3.
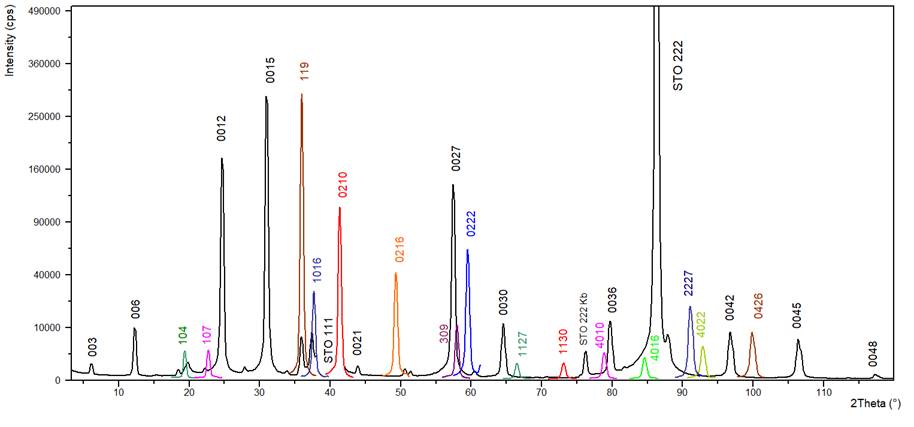
Figure 1. Powder-like diffraction pattern of
Y-phase constructed from selected different peaks measured at specific angles
of inclination y and rotation j by q-2q scans (colors). 00l peaks and peaks from SrTiO3
(STO) substrate were measured in symmetric q-2q scan (black).
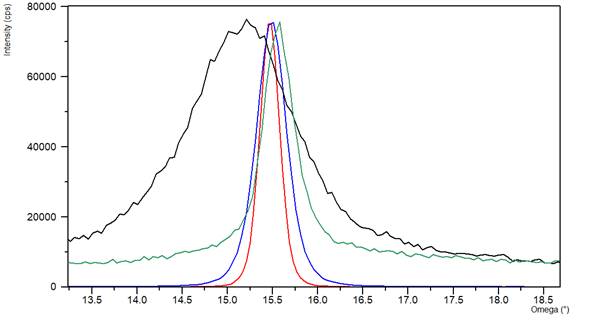
Figure 2. Out-of-plane orientation. w-scans for different films of
Y-phase, deposited on STO (111) - red, showing strong orientation, on LaAlO3
(111) with M-phase seeding layer – blue, on STO (100) – green and on MgO (111)
– black. The curves are roughly normalized to peak height. Higher background
for green curve indicates significant amount of randomly oriented crystallites.
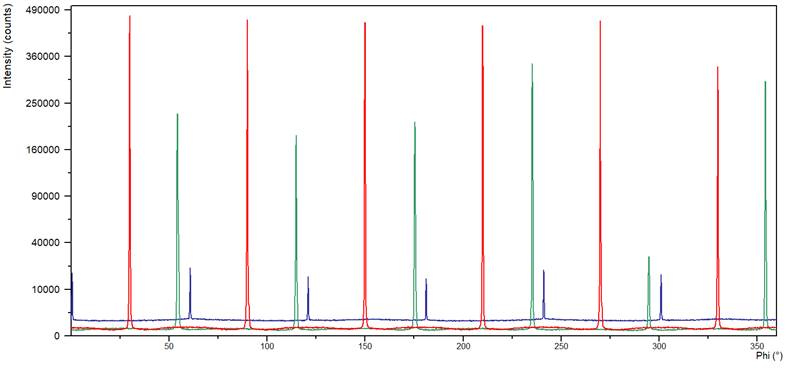
Figure 3a.
In-plane orientation. j-scans for different films of Y-phase on STO (111) substrate. All
indicates good in-plane alignment but with different fraction of non-oriented
crystallites.
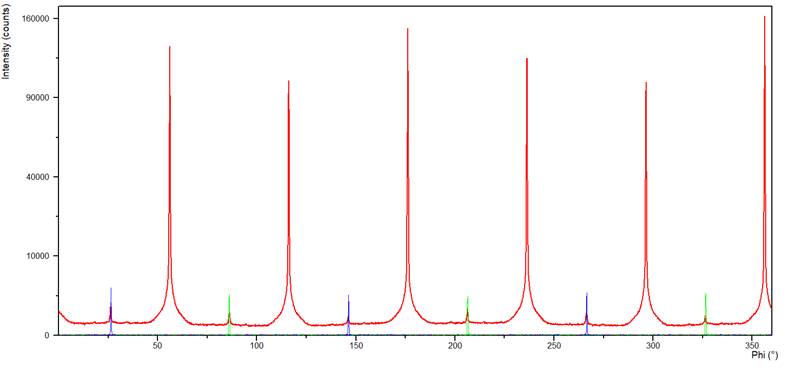
Figure 3b.
In-plane orientation. j-scans for Y-phase on LaAlO3 (111) substrate with wide tails.
j-scans of substrate peaks are shown
in blue (200) and green (220).
Overall picture can be provided also by fast reciprocal space mapping with 2D detector as described in [5] or in more details in [6]. 2D detectors are used without any secondary optics and the direction of the scattered beam is deduced only from the spatial position of a hit pixel. Angular resolution is given by the cross-section of the scattered beam, divergence of the primary beam and the solid angle covered by individual pixels. Therefore, the primary beam should have a small cross-section and should be well collimated horizontally and vertically. The detector can simultaneously measure the intensity of diffracted beams in different directions, i.e., it reveals the intensity distribution in continuous 2D area in reciprocal space without any movement. An appropriately chosen scan measures a set of neighboring 2D slices in reciprocal space. Such dataset when combined reveals the intensity distribution in 3D volume in reciprocal space.
The interpretation of the measured data can be qualitatively based on a direct observation such as a visibility of Debye rings, sensitivity of measured pattern on azimuth or approximate width of partial Debye rings (Figure 4). The measured data can also be compared with the numerical simulation based on some expected model and the model parameters can be optimized to match the experimental data (Figure 5).
Figure 4. Parts of fast RSMs of Y-type
hexaferrites taken at different azimuthal angles j. The arrows indicate their correspondence to the
positions in j scans..In
figures corresponding to the maxima in j scans one can see the chains of diffractions of
Y-phase (on the right side). They can be simulated and shown on the picture
(Fig. 5). It can also be seen that there is a fraction of completely randomly
oriented grains, as it is indicated by the Debye rings.
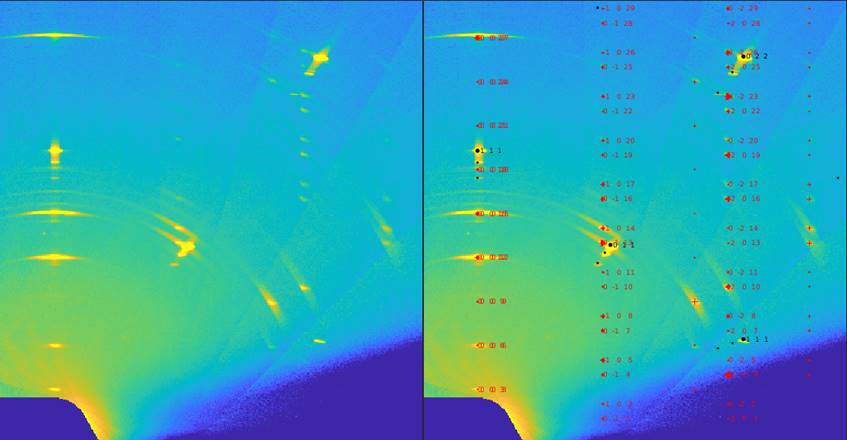
Figure 5. Example of fast RSM section of
Y-type hexaferrites (on the left) with calculated positions of Y-phase
diffractions.
1.
R. Uhrecký, J. Buršík, M. Soroka, R. Kužel, J. Prokleška, Thin Solid Films,
622 (2017) 104-110.
2.
J. Buršík, R. Uhrecký, M. Soroka, R. Kužel, J. Prokleška, Journal of
Magnetism and Magnetic Materials, 469 (2019) 245-252.
3.
Kwang Woo Shin, M. Soroka, Aga Shahee, Kee Hoon Kim, J. Buršík, R. Kužel, M.
Vronka, M. Haydee Aguirre, Advanced Electronic Materials, (2022),
2101294.
4.
R. Kužel, J. Čížek, M. Novotný, Metall. Mater. Trans. A (2013) 45–57.
https://doi.org/10.1007/s11661-012-1432-x.
5.
L. Horák, Materials Structure, vol. 27, no. 2 (2020) 98.
6.
https://hal.science/hal-04058711/
We acknowledge the support by Grant Agency of the Czech Republic no. GACR 24-12710S.