Simple XRD line profile fitting. Program LIPRAS.
Radomír Kužel
Faculty of Mathematics and Physics, Charles University, Ke Karlovu 5, 121 16 Praha 2
Radomir.kuzel@matfyz.cuni.cz
The evaluation of powder diffraction patterns is nowadays often well performed by some form of the Rietveld method that is in principle the method of total powder pattern fitting. The programs like Fullprof [1], GSAS [2], Maud [3] or MSTRUCT [4, 5] and others can use full information obtained in the pattern for refinement of crystal structure, lattice parameters, for phase analysis, estimation of some parameters of real structure, certain evaluation of texture and stress. These programs consider many different parameters related to these quantities and those related to instrumental aberrations and effects. Their success depends on the relevance of the used models and functions to the structure and microstructure of examined samples.
In many cases, it can still be useful just to determine the parameters of individual diffraction profiles. Since these profiles are often overlapped, it is also necessary to decompose them by fitting of suitable functions. For this approach, commercial software can also be used but even this may appear insufficient because to control well the procedure one needs also to easily control possible constraints and bonds between the parameters and mainly to see graphically the decomposition and not only the overall fit. The fitting of peak functions and decomposition of the profiles can be done quite easily in general mathematical software, software plotting graphs like Origin but for evaluation of many experimental patterns this is not ideal either. Moreover, typical laboratory X-ray data include Ka doublets. Open software for fitting of particularly diffraction profiles can still be welcome.
In 1991-2 I have written an MS-DOS program Difpatan with keyboard control. By using short cuts the fits can be done very quickly but currently to run the program, MS-DOS emulation software is required. It can be run well under DOS Box but still it is not so comfortable, and the philosophy of the program may be a little outdated. The program is still available, though [6]. Fitting can also be done well by Winplotr, a part of the Fullprof package. Petr Veřtát created user-friendly program FitExc in Excel that is widely available [7] and the program can be run nearly everywere. The program can be obtained upon request. However, with many data points it can be rather slow. After several attempts to find open simple, fast and robust such a program, I have found the free software LIPRAS (Line-Profile Analysis Software) developed in Matlab at North Carolina State University [8]. The Matlab version requires MATLAB® 2016b, or higher, with Curve Fitting ToolboxTM and GUI Layout Toolbox [9] or at GitHub. In addition to Matlab version, stand-alone version is also available. It utilizes MATLAB® runtime which is free and can be downloaded online or through the installation manager [10].
I have found the software useful, simple to use, robust for fitting of even complicated overlapped diffraction peaks. The fitting is simple. Several different file formats can be used including, of course, two column ASCII data. After opening the file, it is possible to define range of interest, select polynomial for background fitting and click background points. The next window is the main one. There, single wavelength data or XRD lab data (Ka1,2 doublets) should be selected, number of peaks, the used function for each of them and click approximately their positions as initial values for non-linear optimization algorithm. Constraints on fitted parameters can be put, if necessary, and then the fitting can be performed either with or without background refinement. In last window, fitted parameters can be read.
The features of the program are shown in download pages
- Quickly extract relevant peak information about the position, full width at half maximum (FWHM), and intensity
- Conduct Bayesian inference on least-squares results using a Markov Chain Monte Carlo algorithm
- Customize the background fit by either treating it separately (Polynomial or Spline) or including it in the least-squares routine (Polynomial only)
- Can analyzes files with a different number of data points and/or X-values, however, check fitting range before attempting
- Fit up to 20 peaks in the current profile region
- Choose from 5 peak-shape functions: Gaussian, Lorentzian, Pseudo-Voigt, and Pearson VII, and Asymmetric Pearson VII
- Peak-shape functions can be constrained in terms of intensity, peak position, FWHM, and mixing coefficient
- Automatically calculate Cu-Kalpha2 peaks when working with laboratory X-ray data
- Change any of the starting fit values and instantly view a sample plot of the fit, before conducting a fit
- Visualize results with a plot of the resulting peak fit and residual plot
- Parameters files are written to recreate fits and detail what fit parameters and profile shape functions were used
- Accepts the following file types: .xy, .xye, .xls, .xlsx, .fxye, .xrdml, .chi, .csv (Windows Only)
- Resulting coefficients values can be viewed with file number
- For multiple diffraction patterns, results from previous fit are subsequent starting parameters for next fit
The last items allows easy and quick fitting of multiple files. Typically, for example, sets measured with changing temperature when only diffraction parameters of the peaks are smoothly changing and then plot of the parameters vs. file number that can easily be changed to the temperature, for example.
Example of main fitting window is on Fig. 1
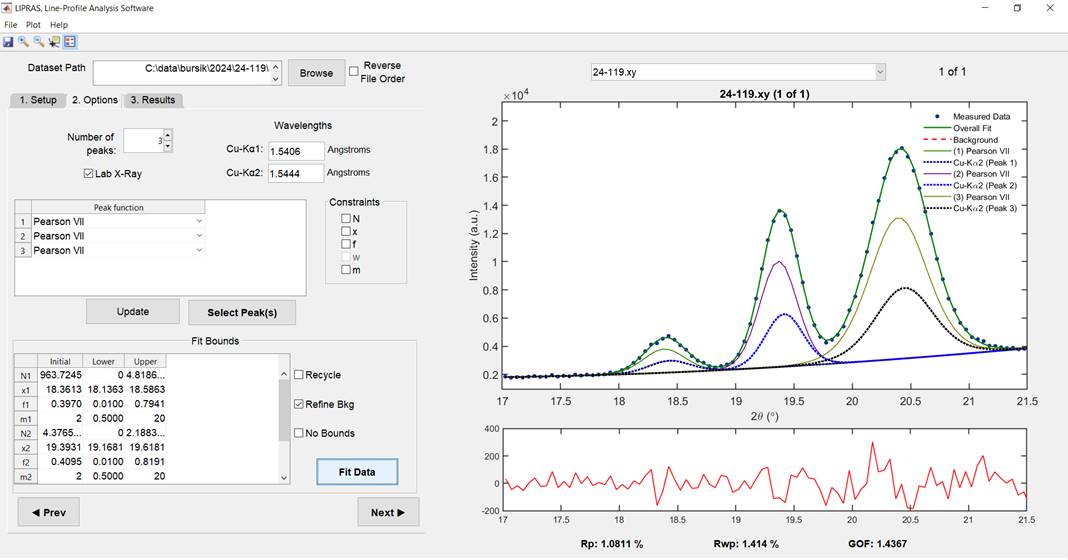
Figure 1. Example of main fitting window with three peaks and Pearson VII function.
1. https://www.ill.eu/sites/fullprof/
2. https://subversion.xray.aps.anl.gov/trac/pyGSAS.
3. L. Lutterotti, Nuclear Inst. and Methods in Physics Research, B268, (2010) 334-340.
4. https://www.xray.cz/mstruct/
5. Z. Matěj, R. Kužel and L. Nichtová, XRD total pattern fitting applied to study of microstructure of TiO2 films, Powder Diffr. 25 S2 (2010), p. 125-131. doi: 10.1154/1.3392371.
6. https://www.xray.cz/priv/kuzel/difpatan/.
7. Petr Veřtát: Materials Structure, 27, no. 2 (2020), 103.
8. Giovanni Esteves, Klarissa Ramos, Chris M. Fancher, and Jacob L. Jones. LIPRAS: Line-Profile Analysis Software. (2017). DOI: 10.13140/RG.2.2.29970.25282/3.
9. https://www.mathworks.com/matlabcentral/fileexchange/62162-line-profile-analysis-software-lipras
10. https://sourceforge.net/projects/lipras/