Combined analysis of CrAlN enriched with Ta magnetron sputtered on WC-Co substrate
Martin Kusý1, Patrik Šulhánek1, Marian Haršáni2 a Ivona Černičková1
1Institute of materials, Faculty of Materials Science and Technology in Trnava. Slovak University of Technology in Bratislava
2STATON, s.r.o., Sadová 1148, 038 53 Turany
In this study the combined analysis comprising of structure, texture, microstructure and stress analysis was applied to CrAlN thin coating enriched with Ta magnetron sputtered on WC-Co substrate. The analysis was carried out using the MAUD program following the concepts introduced in book entitled Combined analysis of Daniel Chateigner.
Experimental material was prepared by tilted co-deposition magnetron sputtering from CrAl and Ta targets on sintered WC-Co substrate which was maintained at 200°C. The pressure was held at 0.40 Pa.
PANalytical Empyrean diffractometer equipped with ChiPhi stage and characteristic Fe filtered Co radiation in point focus was used for measurement. Primary arm contained polycapillary optic with cross slits while the secondary arm was equipped with 0.27 rad parallel plate collimator and proportional Xe detector. The Chi increment was 5° in the range from 0 to 80°and Phi increment at each Chi was 30° in the range from 0 to 360°. In total 204 diffraction patterns were collected in the 2theta range from 30 to 148°. The instrument broadening was determined by measuring NIST LaB6 660c position and profile standard in an entire angular range.
The coating structure model was build based on results from scanning electron microscopy (Fig. 1). The coating thickness was determined at approximately 1 µm with thin Cr adhesion layer at an approximate thickness of 200 nm. Chemical composition from EDX measurement revealed 12 at. % of Al, 16 at. % of Cr, 21 at. % of Ta and 49 at. % of N.
Fig. 1 Microstructure and EDX map of the transversal coating fracture
The layer model built in the MAUD program copied results from microstructural observations. WC-Co substrate model was determined separately from the identical XRD measurement of the substrate. Refined data were taken as constraints at the beginning of the refinement and represented the substrate layer. On top, adhesion Cr coating was modelled followed with the uppermost layer of CrAlTaN with corresponding atomic concentrations.
The quality of the final refinement stage achieved Rwp of 5.02 %. Example of the fit is provided in 2D and 2D residual image (Fig. 2). The final thickness of the coating was determined to 950 nm and adhesive Cr coating thickness 150 nm. The texture of the CrAlTaN described by Harmonics with -1 symmetry is represented by pole figures in Fig. 3. Crystallite size and microstrain were described using an anisotropic Popa model.
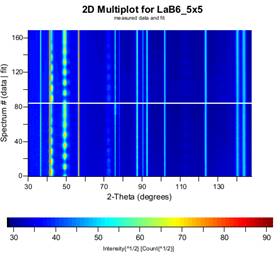
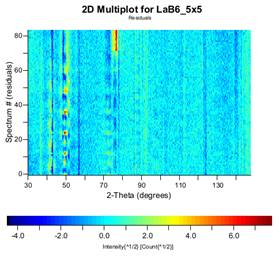
Fig.2 2D plot of the diffraction patterns for Chi range from 0 to 30° with 2D difference plot
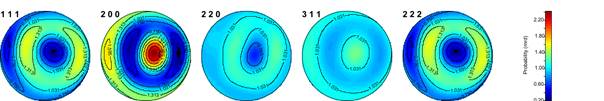
Fig. 3 Pole figures of the CrAlTaN phase
1. Lutterotti, L.; Matthies, S.; Wenk, H.R. MAUD (Material Analysis Using Diffraction): A user friendly Java program for Rietveld texture analysis and more. In Proceedings of the 12th International Conference on Textures of Materials (ICOTOM-12), McGill University Montreal, Montréal, QC, Canada, 9–13 August 1999; pp. 1599–1604. Available online: http://hdl.handle.net/11572/57067 (accessed on 28 July 2021)
2. Chateigner, D.: Combined Analysis, Wiley, 2010