Thermally induced relaxation of creep induced anisotropy
D. Yudina1, M. Marsilius2, P. Sovák1, J. Bednarčík1,3
1Institute of Physics, Faculty of Science, P.J. Šafárik University in Košice, Park Angelinum 9, 041 54 Košice, Slovakia
2VACUUMSCHMELZE GmbH & Co. KG, Hanau, Germany
3Institute of Experimental Physics, Slovak Academy of Sciences, Watsonova 45, 04001 Košice, Slovakia
jozef.bednarcik@upjs.sk
This work is focused on thermally induced relaxation of creep induced anisotropy (CIA) in the FeCuNbSiB nanocrystalline alloy [1]. The various extents of CIA were induced by stress annealing under applying tensile loads up to 480 MPa. Structural changes induced by annealing under uniaxial tensile deformation were investigated using synchrotron X-ray diffraction (XRD). It was shown that Fe3Si nanocrystalline grains growing in the tensile direction have a higher value of the lattice spacing. An opposite behaviour is seen in transversal direction. The difference between the value of the lattice strain determined in the longitudinal and transverse directions is proportional to the magnitude of the tensile stress applied and represents a quantitative parameter determining the degree of creep induced anisotropy (CIA). Strain pole figure (SPF) measurements provide evidence that the CIA is uniaxial, and its main axis is aligned along tensile direction. Quantitative comparison of the SPFs shows that the strain partitioning among different Bragg reflections is not even and {400} family of planes exhibits the highest magnitude of the CIA. Furthermore, it was found that the magnitude of the CIA for a given set of Bragg reflections {hkl} is inversely proportional to its Young’s modulus Ehkl [2].
XRD measurements presented in this work were performed at the P02.1 beamline of the 3rd generation synchrotron radiation source PETRA III at DESY (Hamburg, Germany) [3]. Figure 1 shows typical transmission geometry of XRD experiment at the P02.1 beamline. The incident X-ray beam with photon energy of 59.84 keV (λ=0.02072 nm) was set to a cross-section of 0.5×0.5mm2. About 2 cm long piece of a ribbon specimen was aligned with respect to the incoming beam with tensile direction (RD) being perpendicular to the incident photon beam.
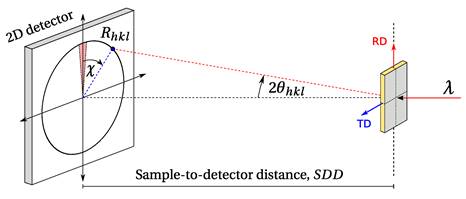
Figure 1. Typical arrangement of the in-situ XRD experiment performed in transmission (Debye-Scherrer) geometry at the P02.1 beamline. RD and TD refer to the rolling (tensile) and transversal directions, respectively. The sample was attached to the heater of the Linkam THMS 600 hot stage, so it was kept at desired temperature Ta.
Each time a fresh specimen with a creep induced anisotropy was put inside a Linkam hot stage THMS 600. Temperature profile during in-situ XRD experiment consisted of two segments: i) constant rate heating at a 10 K/min up to desired temperature Ta followed by ii) isothermal annealing at Ta for up to 5 h. Exposure time per single 2D XRD pattern was set to 20 s. Scattered photons were collected using a 2D detector Perkin Elmer 1621 (2048×2048 pixels, pixel size 0.2×0.2mm2) positioned 654.5 mm downstream from the sample.
|
|
|
Figure 2. 2D XRD pattern of a sample prepared with a maximum value of tensile stress 482MPa. |
Figure 3. The image from Fig.2 after azimuthal integration using a pyFAI. Above 2D map selected intensity profiles corresponding to azimuth angles χ = 0° (RD) and 90° (TD) are depicted. Bragg peaks corresponding to cubic Fe3Si phase are labelled with Miller indices. |
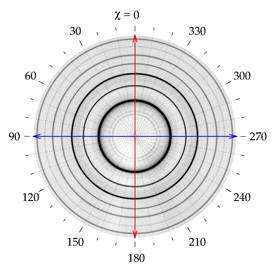
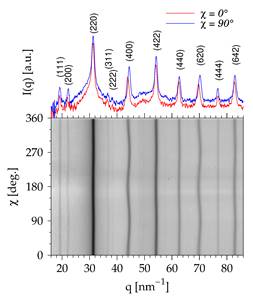
Figure 2 shows a typical raw 2D XRD pattern
as acquired with 2D detector PE1621. Series of concentric rings are due to
presence of cubic Fe3Si phase. The raw 2D XRD pattern was integrated
with respect to the azimuth angle (caking procedure with Δχ = 2°)
using pyFAI [4]. Such operation yielded 180 1D diffraction profiles I(q)
for azimuth angles ![]() (Figure 3). In other
words, the raw diffraction pattern represented in the polar coordinate system
(Figure 2) was transformed to the Cartesian coordinate system (Figure 3). The
reason for doing such a transformation is to make data analysis more efficient.
The presence of the residual strain in the sample prepared with a maximum value
of tensile stress (482 MPa) is readily seen in the Cartesian coordinate system
(Figure 3) as a wavy behaviour of the Bragg peak position with varying azimuth
angle
(Figure 3). In other
words, the raw diffraction pattern represented in the polar coordinate system
(Figure 2) was transformed to the Cartesian coordinate system (Figure 3). The
reason for doing such a transformation is to make data analysis more efficient.
The presence of the residual strain in the sample prepared with a maximum value
of tensile stress (482 MPa) is readily seen in the Cartesian coordinate system
(Figure 3) as a wavy behaviour of the Bragg peak position with varying azimuth
angle ![]() . This also means that
the Bragg peaks appearing in the polar coordination system (Figure 2) as
concentric rings are indeed ellipses. It is also important to note that the
extent of distortion varies among different Bragg reflections. The lattice
strain
. This also means that
the Bragg peaks appearing in the polar coordination system (Figure 2) as
concentric rings are indeed ellipses. It is also important to note that the
extent of distortion varies among different Bragg reflections. The lattice
strain ![]() associated with a set of crystallographic planes {hkl} can be
defined as
associated with a set of crystallographic planes {hkl} can be
defined as
|
|
(1) |
where ![]() is a reference value of
the Bragg peak position and
is a reference value of
the Bragg peak position and ![]() is a peak position at
given azimuth angle
is a peak position at
given azimuth angle ![]() . There are several ways
how to get a reference value. One could retrieve its value from a measurement
on the sample annealed with the lowest value of tensile stress, i.e., 14 MPa.
Another way is to use the data itself and calculate reference value from the so
called zero stress azimuth directions [5,6] which are obtained by solving
equation
. There are several ways
how to get a reference value. One could retrieve its value from a measurement
on the sample annealed with the lowest value of tensile stress, i.e., 14 MPa.
Another way is to use the data itself and calculate reference value from the so
called zero stress azimuth directions [5,6] which are obtained by solving
equation
|
|
(2) |
In this work we used a later method. Figure
4 shows comparison of strain curves calculated according to equation (1) for
different level of stress levels. The sample annealed under stress of 14 MPa
shows no presence of CIA, which is indicated by the constant (zero) value of ![]() curve. With increasing tensile stress magnitude of the CIA
increases as manifested by widening the gap between the maximum (χ = 0°) and minimum (χ = 90°) of strain curve
curve. With increasing tensile stress magnitude of the CIA
increases as manifested by widening the gap between the maximum (χ = 0°) and minimum (χ = 90°) of strain curve ![]() (see Figure 4). Variation of
(see Figure 4). Variation of ![]() with respect to the azimuth angle can be expressed by following
equation
with respect to the azimuth angle can be expressed by following
equation
|
|
(3) |
where ![]() is the longitudinal
strain component,
is the longitudinal
strain component, ![]() is the transversal
strain component and
is the transversal
strain component and ![]() is associated with the
shear strain component. It should be noted here that these are three strain
components associated with the plane defined by the incident X-ray photon beam
being its normal vector. As can be seen from curves presented in Figure 4,
equation (3) satisfactorily describes experimentally obtained strain data.
Fitting experimental data of
is associated with the
shear strain component. It should be noted here that these are three strain
components associated with the plane defined by the incident X-ray photon beam
being its normal vector. As can be seen from curves presented in Figure 4,
equation (3) satisfactorily describes experimentally obtained strain data.
Fitting experimental data of ![]() to the equation (3)
numerical values of respective strain components were determined. In case a
sample is well aligned with respect to the 2D detector the
to the equation (3)
numerical values of respective strain components were determined. In case a
sample is well aligned with respect to the 2D detector the ![]() component becomes
negligibly small.
component becomes
negligibly small.
|
|
|
Figure 4. Comparison of lattice strains corresponding to samples annealed at different levels of tensile stress (14, 241 and 482MPa). Open signs refer to experimental measurements whereas solid lines represent fits to the equation (3). |
Figure 5. Comparison of strain partitioning among different Bragg reflections of Fe3Si phase after applying tensile stress of 241 and 482 MPa. |
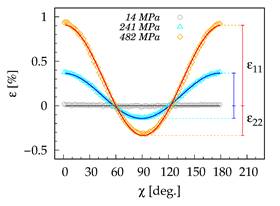
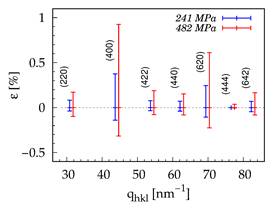
Figure 5 shows partitioning of strain components among selected Bragg reflections of Fe3Si phase as derived from 2D XRD data after applying tensile stress of 241 and 482 MPa. The data presented in the Figure 5 provide evidence that the strain partitioning among different Bragg reflections is not even and family of reflections {400} shows the highest magnitude of CIA. The reason for such behaviour is because Young’s moduli corresponding to respective Bragg reflections are having different magnitudes [7].
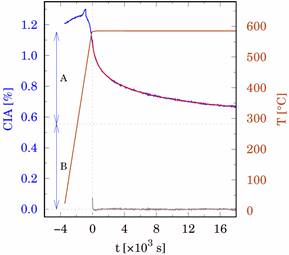
Figure 6 shows creep induced anisotropy
(CIA) for Bragg reflection (400) as a function of time and temperature. The
magnitude of CIA can be quantified as a sum of magnitudes of the longitudinal
and transversal lattice strain, i.e., ![]() .
.![]() When heating a sample to
the temperature of 585°C, it can be seen that structural changes occur in the
sample and a peak at appears, which then completely disappears, and when the
temperature reaches 585 °C, the CIA value decreases exponentially. The solid
red line shown in Figure 6, well describing the measured experimental curve, is
the results of fitting using exponential equation
When heating a sample to
the temperature of 585°C, it can be seen that structural changes occur in the
sample and a peak at appears, which then completely disappears, and when the
temperature reaches 585 °C, the CIA value decreases exponentially. The solid
red line shown in Figure 6, well describing the measured experimental curve, is
the results of fitting using exponential equation
|
|
(4) |
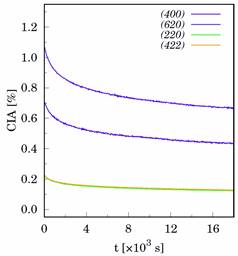
where A is the amplitude, t is time, B is offset, parameters k is the decay parameter and n corresponds to the stretching exponent. Figure 7 shows CIA temporal evolution of CIA for various Bragg reflections during isothermal annealing at 585 °C. By fitting experimental data of the CIA curve to the equation (5) numerical values of respective amplitudes, offset, decay parameter and stretching exponent were determined.
|
|
|
Figure 6. Creep-induced anisotropy behaviour for Bragg reflection (400) as a function of time and temperature, prepared with a maximum value of tensile stress 482 MPa. Solid red line shows the results of the fit using the exponential function. Vertical arrows refer to the actual values of amplitude and offset, A and B, respectively. |
Figure 7. Temporal evolution dependence of creep-induced anisotropy for various Bragg reflection during isothermal annealing at 585 °C. |
Figures 8 and 9 show numerical results obtained from analysing temporal evolution of CIA during isothermal annealing at temperatures 480, 525, 540 and 585 °C.
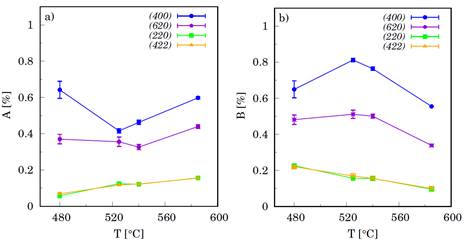
Figure 8. Variation of CIA amplitudes a) A and b) B as obtained by fitting experimental data to the equation (4). Each measurement started with a fresh sample prepared with a maximum value of tensile stress 482 MPa.
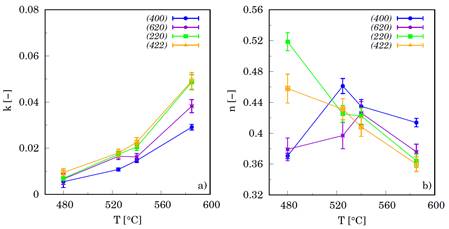
Figure 9. Variation of parameters a) k and b) n as obtained by fitting experimental data to the equation (4). Each measurement started with a fresh sample prepared with a maximum value of tensile stress 482 MPa.
Parameter B represent part of the CIA amplitude, which cannot be removed from specimen by isothermal annealing. On the other hand, A represents part of the CIA amplitude which can be annealed out by extending annealing time to infinity. Data suggest that Bragg reflections showing highest magnitude of CIA also show highest resistance to annealing effects. As can be seen from Figure 9a, the decay parameter k increases with increasing temperature. This implies faster removal of CIA at higher temperatures.
1. G. Herzer, V. Budinsky, C. Polak, Journal of Physics: Conference Series, 266, (2011), 012010.
2. D. Yudina., M. Marsilius, J. Bednarcik, J. Alloys and Comp., 123, (2023), submitted for publication.
3. A.-C. Dippel, H.-P. Liermann, J. T. Delitz, P. Walter, H. Schulte-Schrepping, O. H. Seeck, H. Franz, Journal of Synchrotron Radiation, 22, (2015), 675–687.
4. J. Kieffer, V. Valls, N. Blanc, C. Hennig, Journal of Synchrotron Radiation, 27, (2020), 558–566.
5. J. Bednarcik, L. Y. Chen, X. D. Wang, J. Z. Jiang, H. Franz, Metallurgical and Materials Transactions A, 43, (2012), 1558–1563.
6. N. Mattern, J. Bednarcik, S. Pauly, G. Wang, J. Das, J. Eckert, Acta Materialia, 57, (2009), 4133–4139.
7. J.-M. Zhang, Y. Zhang, K.-W. Xu, V. Ji, Journal of Physics and Chemistry of Solids, 68, (2007), 503–510.
This study was supported by the grant VEGA 1/0406/20. Parts of this research were carried out at the light source PETRA III (beamline P02.1) at DESY, a member of the Helmholtz Association (HGF).