Phase transformations in Ti-15Mo single crystal
investigated by synchrotron X-ray diffraction
J. Šmilauerová, P. Zháňal, L. Horák, P. Harcuba, J. Veselý, V. Holý
Faculty of Mathematics and
Physics, Charles University, Ke Karlovu
5, 121 16, Prague, Czech Republic
smilauerova@karlov.mff.cuni.cz
In metastable titanium alloys, the
transformation from the high-temperature β phase (bcc) to the
low-temperature α phase (hcp) can be suppressed upon quenching to room
temperature
The main goal of this research is to
investigate the sequence of transitions occurring in single-crystals of Ti-15Mo
(in wt.%) alloy during linear heating by synchrotron X-ray diffraction. For
this purpose, a single crystal was prepared using the floating zone method
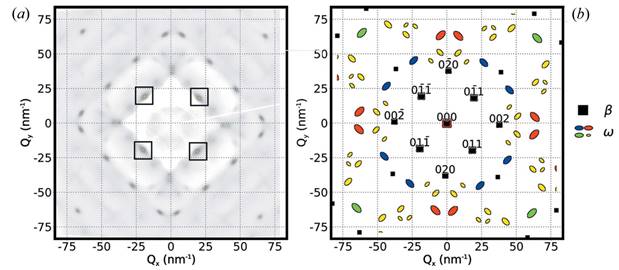
X-ray diffraction was measured at the high-energy beamline ID11 at ESRF, Grenoble. The photon energy was 60 keV and the primary beam was parallel to [100]β direction in the studied crystal. The heating was performed in a dedicated furnace equipped with a quartz chamber, allowing to reach high vacuum (approx. 10-6 mbar). The diffracted signal was collected in situ during linear heating with the rate of 5°C/min. An example of a measured diffraction pattern together with calculated pattern explaining the origin of individual peaks is displayed in Fig. 1.
|
|
Figure 1. a) Measured diffraction
pattern at room temperature and b) calculated pattern showing the positions
of observed β and ω diffraction spots (square and ellipse symbols,
respectively).
|
The set of measured data allowed us to determine the sequence of phase transformations by following the evolution in regions around selected ω diffraction spots during linear heating, see Fig. 2. The intensity in these regions first decreases with increasing temperature, but the ω reflections do not disappear completely. On the contrary, around 673 K (400 °C), the ω peaks sharpen and their intensity increases – this is most visible in Fig. 2 c) which shows an ω spot closest to the Ewald sphere (Figs. 2 a) and b) display ω peaks further from the Ewald sphere, so the intensity increase is not readily apparent due to their sharpening). At 833 K (560 °C, denoted by a black vertical line in Fig. 2), all ω reflections disappear, suggesting a complete dissolution of the ω phase. The intensity observed at the highest measured temperatures corresponds to α phase diffraction spots which lie close to the original ω reflections.
|
|
|
|
Figure 2. Evolution of a) |
Figure 3. Evolution of ω phase fraction of the ω phase (red points) and the β/ω interface area (blue points). |
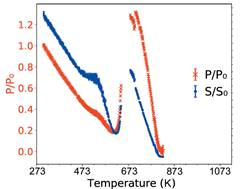
Numerical
fitting of measured diffraction peaks allowed us to estimate the temperature dependence of ω phase fraction (red points in
Fig. 3) and interface area between the β matrix and ω particles
(blue points in Fig. 3). Both quantities depend linearly on the number of
irradiated ω particles; the steeper decrease of S/S0
above 523 K (250 °C) suggests that while ω particles grow, their
number decreases (a process similar to Ostwald
ripening). The increasing trend observed in Fig. 3 is caused by
progressive coarsening of ω particles. As the temperature nears the
stability limit of the ω phase at 833 K (560 °C), both the phase
fraction and the interface area decrease rapidly. More information on this
topic and a comparison with complementary data from electrical resistivity
measurements can be found in