Estimation of diffraction limit using paired refinement
M. Malý1,2, P. Kolenko1,2, T. Skálová2, J. Stránský2, L. Švecová1,2, J. Dohnálek2
1FNSPE, Czech Technical University in Prague, Břehová 7, Prague 2, CR
2Institute of Biotechnology of the Czech Academy of Sciences, v. v. i., BIOCEV, Průmyslová 595, Vestec near Prague, CR
malymar9@fjfi.cvut.cz
The high resolution diffraction limit is one of the most important parameters of any solved macro-molecular structure. Thus, it should be estimated carefully in order to avoid both covering too noisy data and discarding data containing useful signal. However, the conservative criteria for data quality indicators (e.g. I/σ(I), Rpim and CC1/2) are not sufficient to determine the proper high resolution diffraction limit as both instrumentation and software have changed in the last decades. This problem can be overcome with the usage of the paired refinement protocol that links crystallographic model and data quality [1]. This approach will be demonstrated on an exemplary dataset.
Diffraction data from a crystal of a heme-dependent globin domain were collected at the Helmholtz-Zentrum Berlin (BESSY II) on beamline 14.1 using a Dectris PILATUS 6M detector. The data were processed in XDS [2]. The initial high resolution cut-off was set to 1.85 Å according to a conservative criterion for I/σ(I). Molecular replacement was successful and the structure model was refined in REFMAC5 [3] using isotropic B-factors. R‑values of the obtained structure model were: Rwork = 0.1924, Rfree = 0.2413. The structure containing 11,467 atoms has been deposited in the Protein Data Bank under the code 5OHE [4].
Recently, the paired refinement protocol was performed on the original diffraction data to analyse the impact of the data from high resolution. At first, the structure model was refined using data up to resolution 1.80 Å. Both R-values decreased moderately (Figure 1). Thus, even weak data from the shell 1.85–1.80 Å caused an improvement of the structure model (the quality indicators of data in this shell have following values: I/σ(I) = 1.4, CC1/2 = 0.820. Refinement against data up to resolution 1.75 Å, 1.70 Å, and 1.65 Å did not cause further improvement as the Rfree-value increased slightly in these cases.
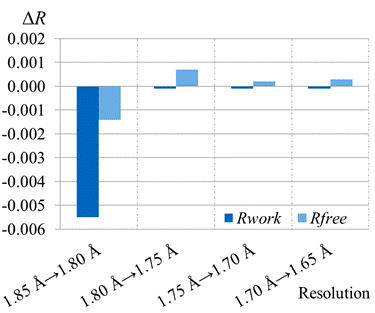
Figure 1. R-value analysis of paired refinement results. For each incremental step of resolution from X→Y, the R‑values were calculated at resolution X.
According to these results, the optimal high resolution diffraction limit was determined as 1.80 Å resolution. It does not look like a large difference in comparison with the previous choice (1.85 Å). However, the resolution shell 1.85–1.80 Å contains 9,929 unique reflections (8 % of whole dataset) which is not a negligible number, given the number of refined parameters (45,388).
1. P. A. Karplus & K. Diederichs, Science 336, (2012), pp. 1030–1033.
2. W. Kabsch, Acta Cryst. D, 66, (2010), 125.
3. G. N. Murshudov, A. A. Vagin, E. J. Dodson, Acta Cryst. D, 53, (1997), pp. 240–255.
4. M. Stranava et al., J. Biol. Chem., 292, (2017), pp. 20921-20935.
This publication was supported by projects CAAS (CZ.02.1.01/0.0/0.0/16_019/0000778) and CIISB4HEALTH (CZ.02.1.01/0.0/0.0/16_013/0001776) from the ERDF fund and by the GA CTU in Prague (SGS19/189/OHK4/3T/14).