Development of x-ray analytical techniques using standard laboratory diffractometers
O. Caha
Department of condensed matter physics, Masaryk University, Kotlářská 2, 611 37 Brno
caha@physics.muni.cz
In the last couple of years our laboratory has implemented couple of x-ray analytical techniques unusual in laboratories. We will present couple of methods which has been implemented and succesfully tested. We will discuss standing wave x-ray fluorescence, rocking curve imaging and absorption spectroscopy.
X-ray fluorescence spectroscopy was implemented using energy dispersive detector Amptek (Si PIN diode). The detector was mounted as the second detector to the standard x-ray diffractometer with copper or molybdenum anode. The primary beam is monochromatized and collimated with a multilayer parabolic Göbel mirror and Ge(220) channel cut monochromator. We have measured angle of incidence dependence of the fluorescence radiation simultaneously with reflected or diffracted radiation. In usual case the method allows us to determine depth profile of the chemical composition. The measurement is usually performed for low angles of incidence; penetration depth changes from couple of nanometers below angle of total external reflection towards couple of micrometers for higher angles of incidence.
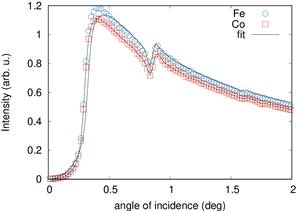
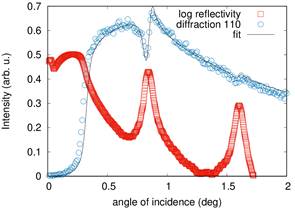
As an example we present results obtained at polycrystalline periodic multilayers FeCo/Al2O3. The samples have very thin layers of magnetic FeCo with thickness between 1.3 nm to 2 nm separated by 3 nm spacer of insulating Al2O3. The samples with thinner FeCo layer exhibit superparamgnetic properties with extremally high relative permeability values up to 104. We have studied the samples using x-ray fluorescence and diffraction at low angles of incindence. At the reflection maxima the incident and reflected wave form a standing wave within the superlattice. Fitting angular dependences of fluorescence and diffraction signal we were able to determine size and position of crystalline FeCo particles and also compositional profile of Fe and Co in the superlattice. We have found the concetration of interdiffused metallic atoms into insulating spacer to be between 8% and 10% [1]. The examples of fluorescnce and diffraction profiles are presented in figures 1 and 2.
|
|
|
Figure 1. Angle of incidence dependence of Fe and Co fluorescence signal. |
Figure 2. Angle of incidence dependence of FeCo 110 diffraction signal. Reflectivity curve in logaritmic scale. |
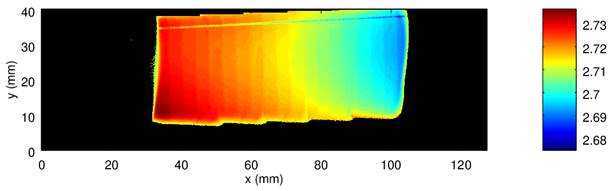
Another method implemented in our laboratory is rocking curve imaging using two dimensional detector. We have used diffractometer Rigaku SmartLab with 2D detector Hypix3000, which we have mouted close to the sample using a home made holder. The detector can be put at the minimal distance of approximately 10 mm from the sample in the case of asymmetric grazing incidence diffraction. Such setup has also advantage of large irradiated area with a limited beam size and low divergence of the diffracted beam. The resolution is limited by the pixel size of detector (0.1x0.1 mm2). At the angle of incidence of 1o we can achieve irradiated area up to 25x60 mm2. This method can provide locally resolved informations such as curvature of the sample, chemical composition of alloyed layers, diffraction peak width and intensities, which present information of defects. The example of the peak position map of bent silicon wafer is presented in figure 3.
|
|
Figure 3. Map of 311 diffraction peak position measured at bent silicon wafer. |
Last presented method is x-ray absorption spectroscopy used for absolute quantification of certain elements concetration. We have used it for barium quantification in a medical radiation shielding foil. We have again used standard x-ray diffractometer with copper rotating anode and accelerating voltage of 45 kV. The barium K absorption edge (38 keV) was then measured with a white primary beam in Bragg-Brentano setup monochromatized with a silicon (111) monocrystal. Measurement in tha Bragg angle range of 5o to 7o corresponds to energy range 44 to 33 keV. This range covers clearly barium absorption edge allowing us to determine absolute concentration usin tabulated values of absorption coefficients [2].