X-ray diffraction analysis of epitaxial layers with depth-dependent composition
E. Dobročka
Institute of Electrical
Engineering, Slovak Academy of Sciences, Dúbravská cesta 9,841 04 Bratislava, Slovak Republic
edmund.dobrocka@savba.sk
High
resolution mode is a special branch of X-ray diffraction techniques devoted to
the analysis of single crystalline epitaxial layers. One of the most important
tasks in epitaxial technologies is the determination of the layer composition.
For epitaxial systems with high degree of perfection, e. g. Si- or GaAs-based
compounds, the recorded diffraction curves have rather complex form and the
layer parameters are routinely determined by computer simulation of the model
structure. For epitaxial layers based on materials with lower quality and/or
larger lattice mismatch, the fine features of the diffraction curves are
missing and only more or less separated diffraction maxima of individual layers
can be observed. Typical examples of such materials are the
III–nitride semiconductors as AlN, GaN, InN and their ternary alloys. These materials
have great potential for use in optoelectronic and high-temperature electronic
devices due to their wide range of bandgaps and high-temperature stability [1-3].
If the layers are perfectly matched to the substrate,
it is sufficient the measuring of one symmetric
diffraction of the type ![]() . But in
the case of layers exhibiting certain degree of relaxation, in addition to the
symmetric diffraction, at least one asymmetric diffraction has
to be measured. From the position of the diffraction spots the
composition as well as the degree of relaxation can be determined. For the GaN based compounds the most convenient and accessible
asymmetric diffraction is
. But in
the case of layers exhibiting certain degree of relaxation, in addition to the
symmetric diffraction, at least one asymmetric diffraction has
to be measured. From the position of the diffraction spots the
composition as well as the degree of relaxation can be determined. For the GaN based compounds the most convenient and accessible
asymmetric diffraction is ![]() . There
are six equivalent diffractions of this type in hexagonal materials but if the
lattice tilting does not take place, it is, in principle, sufficient to measure
only one of these diffractions. However, measuring of several diffractions
increases the precision of the evaluation. Further simplification stems from
the symmetry of the stress state of the layer. Hexagonal c-oriented epitaxial
layers are transversely isotropic, i.e. the deformation of the layer is
completely described by two nonzero strain components:
. There
are six equivalent diffractions of this type in hexagonal materials but if the
lattice tilting does not take place, it is, in principle, sufficient to measure
only one of these diffractions. However, measuring of several diffractions
increases the precision of the evaluation. Further simplification stems from
the symmetry of the stress state of the layer. Hexagonal c-oriented epitaxial
layers are transversely isotropic, i.e. the deformation of the layer is
completely described by two nonzero strain components:
|
|
(1) |
where ![]()
![]() and
and ![]() ,
, ![]() are the lattice parameters of strained (and
measured) and fully relaxed layer, respectively [4]. These components are
connected by the relation
are the lattice parameters of strained (and
measured) and fully relaxed layer, respectively [4]. These components are
connected by the relation
|
|
(2) |
where ![]() and
and ![]() are the composition dependent stiffness constants
of the material. Alternatively,
instead of in-plane strain
are the composition dependent stiffness constants
of the material. Alternatively,
instead of in-plane strain ![]() , the degree of relaxation
, the degree of relaxation ![]() defined as
defined as
|
|
(3) |
is often used to describe the strain state of the
epitaxial layer. It has to be pointed out that the parameter ![]() characterizes the strain state of the layer
with respect to the substrate lattice.
characterizes the strain state of the layer
with respect to the substrate lattice.
The values of ![]() and
and ![]() can be calculated from the reciprocal
co-ordinates
can be calculated from the reciprocal
co-ordinates ![]() and
and ![]() of the layer diffraction spot
of the layer diffraction spot ![]() as [5]
as [5]
|
|
(4) |
The unknown composition parameter ![]() and the in-plane strain
and the in-plane strain ![]() can be obtained by solving the system of
equations in (1) and (2). A simple iterative procedure that
uses
can be obtained by solving the system of
equations in (1) and (2). A simple iterative procedure that
uses ![]() and
and ![]() in (4) as input parameters is outlined in [6].
The method supposes linear dependence of the parameters
in (4) as input parameters is outlined in [6].
The method supposes linear dependence of the parameters ![]() ,
,
![]() and
and ![]() ,
,
![]() on the composition
on the composition ![]() .
.
The complete information on the state of the epitaxial
layer can be obtained by measuring the reciprocal space map (RSM) around a
suitable asymmetric diffraction. For the later purposes it is reasonable to
introduce the presentation of the admissible positions of the layer spots in
reciprocal space in dependence of the layer composition and the degree of
relaxation. It follows from simple geometrical considerations that in the case
of AlGaN/GaN and InGaN/GaN systems the possible positions of the layer
diffraction spot are confined to triangular region in the vicinity of GaN
diffraction. This area is bounded by the so called relaxation line connecting
the AlN or InN layer diffraction spots for fully strained and completely
relaxed state [7]. The third vertex of the triangle is the GaN substrate (or
buffer layer) diffraction spot. However, for the system InAlN/GaN this area
comprises two triangular regions as shown in Fig. 1. This is a consequence of
the fact that the lattice parameters of GaN are in between the parameters of
InN and AlN lattices. The common vertex of these triangles corresponds to the
composition of the InxAl1-xN for which the layer is
perfectly matched to the GaN lattice. It is worth noting that this point in
reciprocal space does not coincide with the GaN diffraction spot. This is a
general property of hexagonal epitaxial systems and it stems from different
values of aspect ratios of InxAl1-xN and GaN lattice.
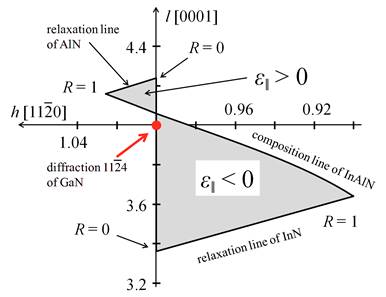
Figure 1. Schematic drawing
of the admissible positions of the  diffraction spot of InAlN
layer for various composition
diffraction spot of InAlN
layer for various composition  and degree of relaxation
  . Note the sign of the in-plane strain component
  is opposite in Al rich and In
rich regions. For the sake of clarity the width of the area is 6-times
enlarged.
is opposite in Al rich and In
rich regions. For the sake of clarity the width of the area is 6-times
enlarged.
If InxAl1-xN layer is grown on GaN buffer
layer in sequence (without breaking the growth after GaN), unintentional
Ga-auto-incorporation into InxAl1-xN layer is an obvious problem, as
reported in [8-10]. Sources of Ga could be the deposited Ga-containing-residues
on the reactor wall, susceptor or shower head during GaN growth. Due to the
Ga-incorporation in InAlN, intended InxAl1-xN ternary alloy actually becomes
InxAlyGa1-x-yN quaternary
alloy. This has a significant consequence for the evaluation of X-ray
diffraction measurements, e. g. for the interpretation of the RSM. In the case
of ternary compounds each couple of lattice parameters a and c of
strained layer measured by X-ray diffraction has a unique solution ![]() ,
, ![]() ,
,
![]() and
and ![]() . Evidently,
this is not valid for quaternary compounds. In this case the composition of the
layer is described by two parameters, e. g. InxAlyGa1-x-yN,
and the measured values of strained lattice parameters
. Evidently,
this is not valid for quaternary compounds. In this case the composition of the
layer is described by two parameters, e. g. InxAlyGa1-x-yN,
and the measured values of strained lattice parameters ![]() and
and ![]() can be interpreted by an infinite number of
can be interpreted by an infinite number of ![]() ,
, ![]() values resulting in different relaxed lattice
parameters
values resulting in different relaxed lattice
parameters ![]() ,
,
![]() and
different degree of in-plane strain
and
different degree of in-plane strain ![]() . As an illustration,
in Tab. 1 five different compositions of quaternary InxAlyGa1-x-yN
layer resulting in the same values of measured lattice parameters are listed.
. As an illustration,
in Tab. 1 five different compositions of quaternary InxAlyGa1-x-yN
layer resulting in the same values of measured lattice parameters are listed.
Table 1. Five compositions
of quaternary InxAlyGa1-x-yN layer for the same
values of measured lattice parameters and corresponding relaxed lattice parameters
![]() ,
, ![]() and in-plane strain component
and in-plane strain component ![]() .
.
|
Ga [%] |
In [%] |
Al [%] |
|
|
|
|
0.0 |
18.4 |
81.6 |
0.31898 |
0.51134 |
– 0.14 |
|
5.0 |
17.2 |
77.8 |
0.31884 |
0.51147 |
– 0.09 |
|
10.0 |
16.0 |
74.0 |
0.31870 |
0.51160 |
– 0.05 |
|
15.0 |
14.7 |
70.3 |
0.31856 |
0.51173 |
– 0.006 |
|
20.0 |
13.5 |
66.5 |
0.31843 |
0.51187 |
0.04 |
This example clearly demonstrates that in the case of
quaternary compounds the X-ray measurements alone are insufficient for the
determination of the layer composition and further independent analytical
technique is required for the evaluation of the structural parameters of the
layer. Moreover, the concentration of Ga atoms in the InxAl1-xN
layer is strongly dept-dependent with higher value at the bottom close to the
GaN buffer layer. The depth distribution of the elements in the quaternary
layer can be determined e. g. by Rutherford backscattering spectrometry (RBS),
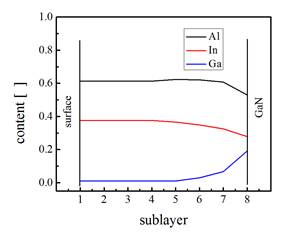
X-ray photoelectron spectroscopy etc. An example of depth profile of the layer
composition obtained by RBS measurement is given in Fig. 2. It is seen that the
highest concentration, almost 20%, of Ga is at the bottom of the layer and from
the middle up to the layer surface the Ga content is negligible. The distance
between the adjacent sublayers is ~ 40 nm. The total layer thickness is ~280
nm. These measurements can be combined with the X-ray results in the way
outlined in the following.
|
|
|
Figure 2. Depth profile of InAlGaN layer composition. The distance between the adjacent sublayers is ~ 40 nm. |
Figure 3. Composition & Relaxation diagram of InAlGaN layer. The position of two maxima revealed by X-ray RSM are schematically shown as ellipses. |
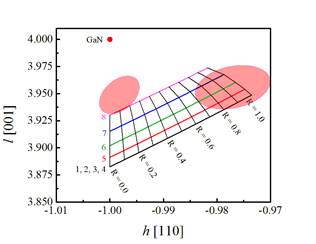
The data describing the depth distribution of the
elements in the layer are used as input parameters and the theoretical
relaxation lines are calculated for all sublayers with their particular composition
obtained by RBS analysis. The set of calculated relaxation lines plotted in
reciprocal space build up a special mesh – the composition & relaxation
diagram. Each relaxation line in this diagram is connected with a sublayer in
different depth, hence at favourable circumstances the eventual depth
distribution of the relaxation can be established simply by comparison of the
diagram with the measured RSM (not shown here). Such a comparison is given in
Fig. 3.
It is seen that in
addition to the basic GaN diffraction ![]() two distinct but rather broad maxima
corresponding to epitaxial layer were revealed. They are schematically depicted
in the diagram as transparent red ellipses. The curves of constant degree of
relaxation
two distinct but rather broad maxima
corresponding to epitaxial layer were revealed. They are schematically depicted
in the diagram as transparent red ellipses. The curves of constant degree of
relaxation ![]() are also shown. It can be concluded that the
InAlN layer with incorporated Ga atoms is apparently divided into two layers.
The maximum on the left side can be ascribed to the bottom layer with high Ga
content. The layer is almost perfectly matched to the GaN buffer layer. It is
also evident that the Ga content provided by RBS measurement is somewhat
underestimated, the maximum does not lie on the deepest relaxation line having
the highest Ga content. The right side maximum can be related to the upper
layer with negligible Ga content. The layer is almost fully relaxed.
are also shown. It can be concluded that the
InAlN layer with incorporated Ga atoms is apparently divided into two layers.
The maximum on the left side can be ascribed to the bottom layer with high Ga
content. The layer is almost perfectly matched to the GaN buffer layer. It is
also evident that the Ga content provided by RBS measurement is somewhat
underestimated, the maximum does not lie on the deepest relaxation line having
the highest Ga content. The right side maximum can be related to the upper
layer with negligible Ga content. The layer is almost fully relaxed.
1.
J. Kuzmík, IEEE
Electron Device Lett., 22,
(2001), 510.
2.
Y. Yue, Z. Hu, J. Guo, B. Sensale-Rodriguez, G.
Li, R. Wang, F. Faria, T. Fang, B. Song, X. Gao, IEEE Electron Device Lett., 33,
(2012), 988.
3.
J. Kuzmík, A.
Georgakilas, IEEE Trans. Electron Dev.,
58, (2011), 720.
4.
A. Krost, A. Dadgar, G.
Strassburger, R. Clos, phys. status solidi A, 200, (2003), 26.
5.
E. Dobročka, S.
Hasenöhrl, P. Chauhan, J. Kuzmík, Appl.
Surf. Sci. 461, (2018), 23.
6.
P. Chauhan, S.
Hasenöhrl, E. Dobročka, Ľ. Vančo, R. Stoklas, J. Kováč, P. Šiffalovič, J.
Kuzmík, Appl. Surf. Sci. 470, (2019), 1.
7.
U.
Pietsch, V. Holý, T. Baumbach, High-Resolution
X-Ray Scattering, second ed., Springer, New York, 2004.
8.
S. Choi, H. J. Kim, Z.
Lochner, J. Kim, R. D. Dupuis, A. M. Fischer, Yu. R. Juday, T. L. Huang, J. Y.
Huang, F. A. Ponce, J.-H. Ryou, J. Cryst.
Growth, 388, (2014), 137.
9.
J. Kim, Z. Lochner,
M.-H. Ji, S. Choi, H. J. Kim, J. S. Kim, R. D. Dupuis, A. M. Fischer, Yu. R.
Juday, T. L. Huang, J. Y. Huang, F. A. Ponce, J.-H. Ryou, J. Cryst. Growth, 388,
(2014), 143.
10.
M. Hiroki, Y. Oda, N.
Watanabe, N. Maeda, H. Yokoyama, K. Kumakura, H. Yamamoto, J. Cryst. Growth, 382,
(2013), 36.
The author gratefully
acknowledges S. Hasenöhrl for providing the
sample and D. Machajdík for RBS measurement.