New nonstandard models in MSTRUCT and unconventional analysis of nanocrystalline and amorphous like materials
Z. Matěj1, M. Dopita2, J. Endres2
1MAX IV Laboratory, Lund University, Lund, Sweden
2Faculty of Mathematics and Physics, Charles University, Praha, Czech Republic
zdenek.matej@maxiv.lu.se
Beside crystal structure solution, refinement of lattice parameters and quantitative phase analysis, characterization of sample microstructure from powder diffraction data is one of the most common quantitative crystallographic methods used in material science. There are numerous free crystallographic software available and one originally developed in Prague, called MSTRUCT [1-2], is just suitable for the microstructure analysis. Thanks to the original design based on ObjCryst/FOX [3] it is free and modular, i.e. various new microstructure models can be added by everyone with appropriate technical and scientific knowledge. An MSTRUCT extension for the line profile analysis of individual diffraction peaks and its application to materials with anisotropic line broadening were reported in [4] in 2014. In this contribution we describe new nonstandard models implemented and used for the diffraction analysis. These are:
· anisotropic size broadening from crystallites with rod, platelet and ellipsoidal shape [5]
· instrumental function for parallel beam reflection geometry with position sensitive detectors
· stacking faults on prismatic planes in Tungsten Carbide
· Warren-Bodenstein model for turbostratic nanoparticles [6]
· configuration model for description of bimodal microstructure [7]
Anisotropic size broadening
Anisotropic size broadening model was missing in MSTRUCT for a long time. A model of rods and platelets like crystallites [5] is briefly introduced and compared with result from the classical profile analysis [4]. Recently the models of shape broadening were also complemented with quite common model of ellipsoidal shape that is an independent contribution (Jan Enders from Charles Uni.).
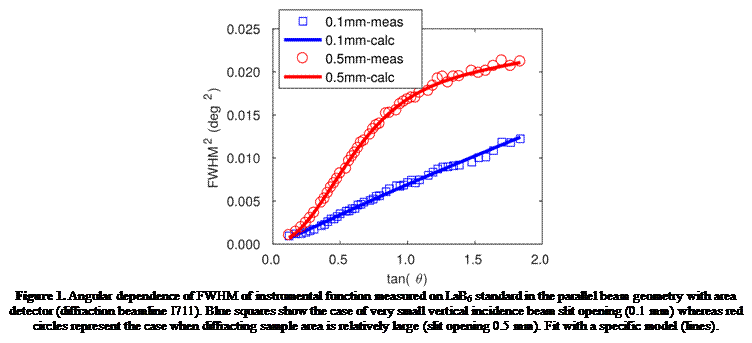
Instrumental function for parallel beam reflection geometry with position sensitive detectors
Coplanar parallel beam geometry is often used for thin films measurements. With laboratory instruments it is optimally complemented with a long Soller slits analyser making the measurement directionally sensitive and providing a decent resolution (0.05°−0.3°). Nowadays linear position sensitive and area detectors are very common in X-ray laboratories and micr focusing X-ray optics can deliver small beam to sample not only at synchrotrons. As already present the position sensitive detector can be an alternative to the setup with analyser under the favourable geometrical conditions (diffracting sample area, detector distance and strip or pixel dimensions). However when the diffracted sample area is still finite and in a common case of constant incidence beam angle, the resolution is dependent on the exit angle of the beam. We introduce an additional term describing this effect. A comparison is depicted in Fig. 1.
Stacking faults on prismatic planes in Tungsten Carbide
Stacking faults on prismatic {1-100} planes in hexagonal WC are quite common defects. We present an alternative description of diffraction line broadening that is very similar to an educational example of 1D atomic chain for phonon dynamics. We compare the MSTRUCT implementation with DIFFaX simulations and experimental data.
Warren-Bodenstein model for turbostratic nanoparticles
Scattering from turbostratic (Carbon) nanoparticles can not be described by standard methods because of lack of orientation ordering of subsequent 2D Graphene-like layers. A Warren-Bodenstein method for a fast computation of this effect as used by Dopita et al. [6] was implemented (see Fig. 2) in order to quantitatively characterize samples of crystalline mixtures with Carbon black nanoparticles used as fillers.
Configuration model for description of bimodal microstructure
Uniform microstructure of a given crystalline phase is a common assumption in diffraction data analysis. However it is often not the case in nature. Bimodal grain size and the interaction between the two-microstructures with the same or very similar atomic structure is a key point driving properties of fine grained metals and alloys. Similar effects are crucial for catalytic nanoparticles, nucleation and crystallization processes or structural changes in pigments of ancient paintings. Refinement of bimodal microstructure of recrystallized fined grained Copper was discussed in [7]. It is also shown there the method is very robust for nanocrystalline metal oxides catalysts.
![Text Box:
Figure 3. XRD pattern of ZrO2 (blue points) from [8] and its fit (red curve) using a model of tetragonal-ZrO2 crystalline domains of extremely small size (D ~ 0.8 nm). This corresponds to about 8 ZrO2 molecules. For comparison similar simulated patters for anatase TiO2 (green dash curve) and cubic CeO2 (black dot-dash) are included. CuKa wavelength.](173_files/image002.gif)
Unconventional analysis of nanocrystalline and amorphous like materials
Another very common case is that part of the sample is amorphous. Conventional diffraction analysis cannot give information about non-crystalline fraction of the sample. Pair distribution function measurement may be the solution. However in many cases, see Fig. 3, the sample state is often clear even from low energy (8-15 keV) or laboratory data. Fig. 3 illustrates diffraction patterns from such amorphous-like materials simulated by setting extremely small crystallites size (D ~ 0.8 nm). In this case it also clearly evident which metal oxide (TiO2, CeO2, ZrO2) is present in the sample. In spite of a good fit the phase can not be considered as crystalline as the potential crystal would consist only from about 8-12 molecules. Also the refined model (lattice) parameters can be subjected to systematic deviations [9].
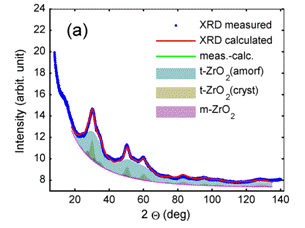
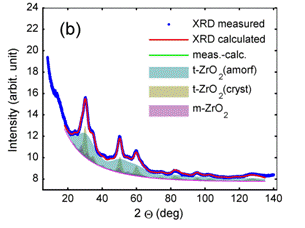
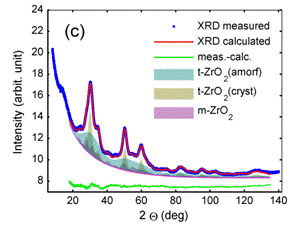
Fig. 4 presents an application case when the amorphous-like oxide is present in the sample together with two additional crystalline phases. The amorphous content can be well characterised just from simple Rietveld refinement without any addition of internal reference standard and the nucleation process can be studied on the pure material.
|
|
|
|
|
|
|
Figure 4. Pattern decomposition of multiphase ZrO2 nanocrystalline samples prepared at different conditions [8]. Tetragonal t-ZrO2 phase posses bimodal microstructure. Model assumes mixture of nanocrystalline t-ZrO2 with crystallites size D ~ 4 nm and amorphous-like fraction similar to Fig. 3. It is evident that the amorphous-like contribution is changing with preparation conditions (differences between figures a-c). Whereas microstructure parameters related to tetragonal and monoclinic ZrO2 crystalline phases do not vary so much, including relative weight fraction of crystalline t-ZrO2 and m-ZrO2. CuKa wavelength. |
1. Z. Matěj, R. Kužel, L. Nichtová, Powder Diffr., 25 S2, (2010), 125. doi: 10.1154/1.3392371
2. Z. Matěj, R. Kužel, M. Dopita, MSTRUCT, www.xray.cz/mstruct (May 26, 2017).
3. V. Favre-Nicolin & R. Cerny, J. Appl. Cryst., 35, (2002), 734. doi: 10.1107/S00218898020
4. Z. Matěj, T. Brunátová, L. Matějová, V. Valeš, D. Popelková, R. Kužel, Materials Structure in Chem. Bio. Phys. Tech., 21 no. 2, (2014), 91. url: goo.gl/Kxc4Uw
5. T. Brunatova, Z. Matej, P. Oleynikov, J. Vesely, S. Danis, D. Popelkova, R. Kuzel, Mater. Characterization, 98, (2014), 26. doi: 10.1016/j.matchar.2014.10.008
6. M. Dopita, M. Emmel, A. Salomon, M. Rudolph, Z. Matěj, Ch.G. Aneziris, D. Rafaja, Carbon, 81, (2015), 272. doi: 10.1016/j.carbon.2014.09.058
7. Z. Matěj, A. Kadlecová, M. Janeček, L. Matějová, M. Dopita, R. Kužel, Powder Diffr., 29 S2, (2014), S35. doi: 10.1017/S0885715614000852
8. L. Matějová, Z. Matěj, J. Supercritical Fluids, Nanostructured ZrO2 synthesized by using pressurized and supercritical fluids - its structural and microstructural evolution and thermal stability, accepted.
9. I. Grey & N.C. Wilson, J. Solid State. Chem., 180, (2007), 670. doi: 10.1016/j.jssc.2006.11.028
The authors thank MAX IV Laboratory (Lund, Sweden) and ID22, ESRF (Grenoble, France) for providing the beamtime.