Diffraction limit in macromolecular crystallography
M. Malý1, P. Kolenko1,2, J. Dušková2, T. Kovaľ2, T. Skálová2, J. Stránský1,2, L. Švecová1,2, J. Dohnálek2
1Faculty of Nuclear Sciences and Physical Engineering CTU, Břehová 7, Prague
2Institute of Biotechnology CAS, v. v. i., BIOCEV, Průmyslová 595, Vestec
malymar9@fjfi.cvut.cz
Choice of the high resolution diffraction limit is an important step in macromolecular structure determination. Nowadays, there are several criteria for resolution cut-off estimation and this can lead to some confusion. To cite P. Evans: “An appropriate choice of resolution limit is difficult and sometimes seems to be performed mainly to satisfy referees.” [1] Data from high resolution contain important information, which is needed to clarify structure details. It is also a significant part (tens of percent) of all dataset observations. Thus these data are not negligible and have a remarkable influence on the resulting structure model.
Diffraction data from a crystal of a FAD-dependent enzyme were collected on beam line P13, Petra III, Hamburg, using a PILATUS 6M detector. Diffraction spots were visible by eye up to resolution of 2.2 Å (Fig. 1). Various modern approaches of diffraction data processing were applied [2-3].
Attempts to estimate the diffraction limit using numerous criteria were performed. The main focus was on the R-factor analysis using the refinement statistics Rwork and Rfree. This criterion links crystallographic model and data quality [4], in contrast with conservative criteria, e.g., I/σ, Rmerge, or CC1/2, that evaluate data quality without relation to model. Impact of various processing approaches on the overall structure quality has been analyzed. The resulting diffraction limit varied from 2.1 Å to 1.7 Å with respect to the selected procedure. The final option 1.9 Å was estimated according to the R-factor analysis mainly, however, also values of the signal-to-noise ratio I/σ were taken into account.
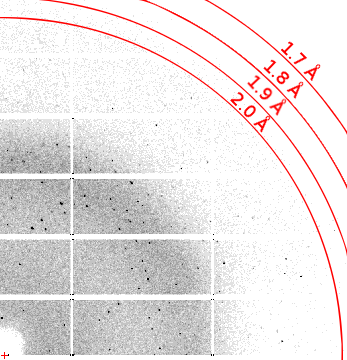
Figure 1. High resolution shells shown on a part of a diffraction image from the crystal of a flavoenzyme.
1. P. R. Evans, Acta Cryst. D, 67, (2001), 282.
2. W. Kabsch, Acta Cryst. D, 66, (2010), 125.
3. N. K. Sauter, J. Hattne, R. W. Grosse-Kunstleve, N. Echols, Acta Cryst. D, 69, (2013), 1274.
4. P. A. Karplus & K. Diederichs, Science 336, (2012), pp. 1030–1033.
This publication was supported by project BIOCEV (CZ.1.05/1.1.00/02.0109) and CIISB4HEALTH (CZ.02.1.01/0.0/0.0/16_013/0001776) from the ERDF fund and by the Grant Agency of the Czech Technical University in Prague, grant No. SGS16/246/OHK4/3T/14.