 |
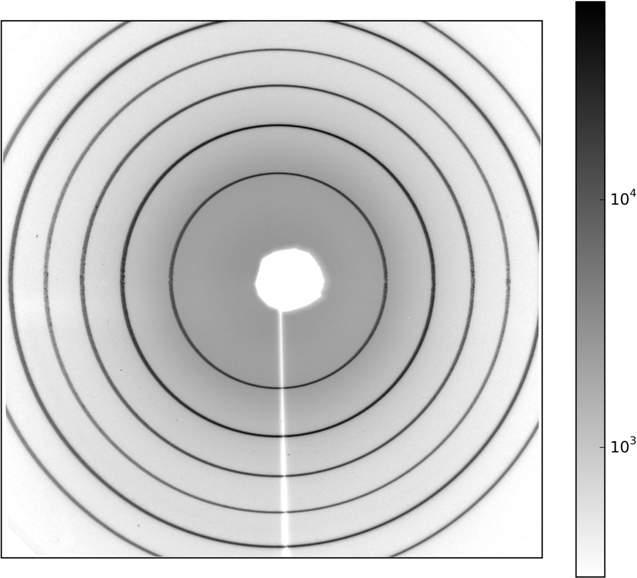
Figure 1. Diffraction image from LaB6 taken with a large CCD. |
Powder X-ray diffraction (PXRD) patterns can be collected in few minutes with common laboratory diffractometers using position sensitive detectors (PSDs) and even within few milliseconds at synchrotron instruments with large PSDs banks [1]. In another standard experimental setup diffraction images of whole diffraction rings (Fig. 1) can be taken with area (2D) detectors and by azimuthal integration using available software (e.g. Fit2D [2], PyFAI [3]) the images are reduced into 1D diffraction patterns. Whereas the finite length of PSD strips implies asymmetry of diffraction lines due to an axial divergence of the X-ray beam accepted by the detector [4, 5], integrated patterns from 2D detectors principally do not suffer from this effect. Good quality data at very low diffraction angles are important for (organic) structures with very large unit cells or if high energy X-rays are used. Recording large azimuthal fraction of diffraction rings is advantageous for intensity and grains statistics too. Disadvantages of static area detectors are limited angular range (2Θmax) and resolution (Δ2Θ). This can be bypassed by continuously scanning 2Θ range with the detector, as e.g. in the powder diffraction beamline 11-BM at APS [6]. We have implemented a similar solution using hybrid pixel detector Pilatus100K in the powder diffraction beamline I711 at MAX-II ring that allows to collect moderate resolution PXRD data of high quality.
|
Figure 1. Diffraction image from LaB6 taken with a large CCD. |
The basis of the underlaying powder
diffraction data reduction procedure is rebinning of intensities in
pixels of thousands (~10k) of diffraction images taken with high
frequency (~50 Hz) during continuous scanning of the detector axis
(Fig. 2). Our solution provides powder diffraction data in a
real time as one is used from laboratory measurements with PSD.
We discuss necessary instrumental corrections and calibration
procedures which should be included as e.g. in xrayutilities [7].
Setup in I711 gives PXRD patterns with moderate resolution (Fig. 3) in both transmission mode with capillaries and reflection mode with solid samples. It is well suitable for microstructure analysis as well as structure solution (Fig. 4).
|
|
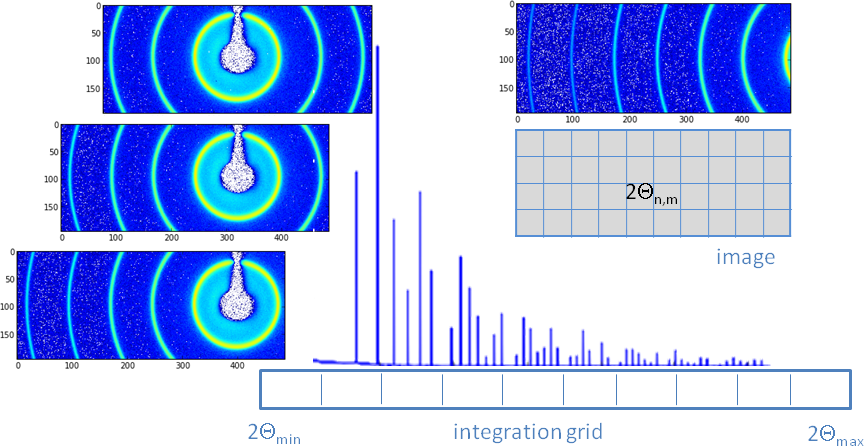
Figure 2. Schematic integration of a series of PXRD images (on the left): intensities from all pixels of each image are moved (rebinned) to appropriate integration bins of the final 1D powder diffraction pattern.
|
|
|
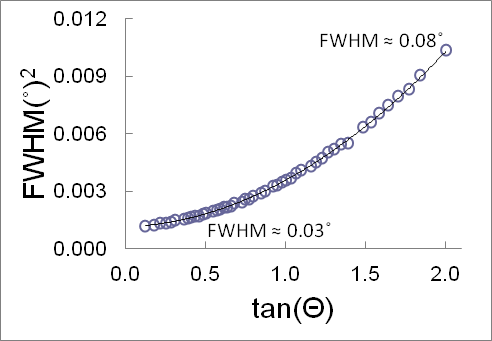
Figure 3. Caglioti plot of the resolution function for the Pilatus100K setup in I711. |
|
|
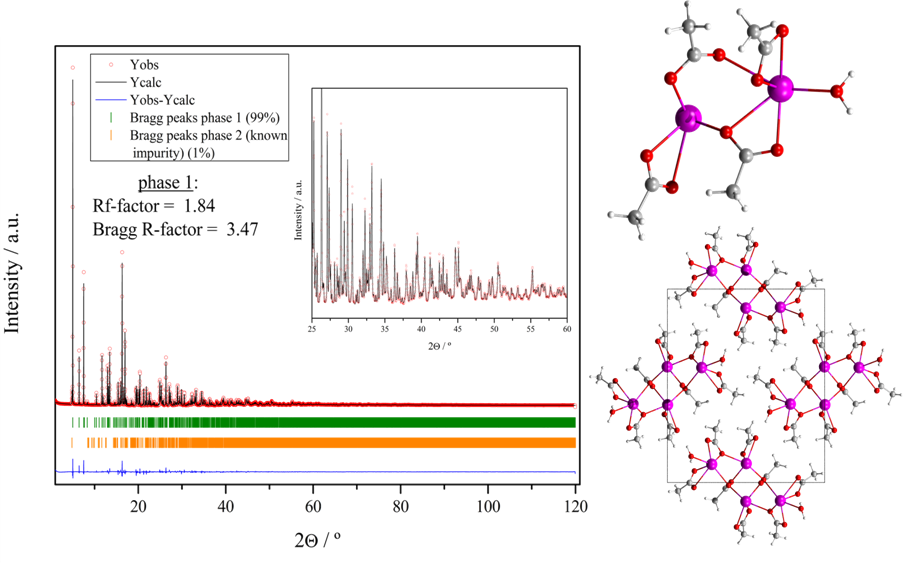
Figure 4. Lead acetate hemihydrate (Pb2C8O9H16) structure solved from PXRD data from I711. |