X-ray Diffraction Analysis of Coal
M. Černík, Z. Kromková, P. Vranec, A. Mašlejová
U.S.Steel Košice, s.r.o., Vstupný areál U.S. Steel, 044 54 Košice
mcernik@sk.uss.com, zkromkova@sk.uss.com, pvranec@sk.uss.com, amaslejova@sk.uss.com,
Coal has been used for production of heat and energy for years. Even nowadays energetic industry consumes significant amount of coal for production of electric energy. High amount of coal is also spent during the production of pig iron. U. S. Steel Košice, s.r.o. purchases and combust coal from different suppliers. The quality of such coal is crucial for the combustion process with regard to the ecology. The quality is considered by different petrographic parameters such as carbon, hydrogen and nitrogen content in the inflammable (daf – dry ash free), content of water, minerals, sulfur, volatile substances etc.
The quality and content of minerals in the coal is determined by chemical procedures, however such data can be optimized by X-ray diffraction method. Measurement and evaluation of diffraction patterns of coal was carried out by several authors [1-3], who refined the mineralogical composition of the coal according to the coal deposit. Among the most common occurring minerals in the coal quartz, kaolinite, muscovite, pyrite, carbonates – calcite, dolomite, siderite and oxides – magnetite, hematite are worth to mention. Coal combustion is carried out at high temperatures, where the minerals change their phase composition, melt and release unfavorable gases, such as CO2 (carbonates) and sulfur (pyrite).
X-ray diffraction analysis was performed on selected samples of black coal. Table 1 summarizes the results of the analyses with the average, minimal and maximum values of determined minerals. Obtained results vary qualitatively and quantitatively according to the sample selection and collection. Graph present in Fig. 1 shows typical diffraction pattern of black coal. Diffraction patterns were measured using Co Kα wavelength and line detector installed on our diffraction device at our X-ray laboratory. Evaluation and refinement was carried out using TOPAS software with Rietveld method.
The importance of measurement and evaluation of diffraction patterns of coal is not just in the analysis of mineralogical composition, but also in the investigation of structural parameters of carbon itself. Pure carbon is graphite with lattice parameters of a = 0.2464 nm and c = 0.6711 nm. Carbon present in coal is not in pure mineralogical form, it is not closely arranged as it contains except of inorganic component also organic part with volatile substances. According to the literature the authors recommend to study the structure of carbon after the removal of mineralogical part in the coal. This needs to be done by leaching of the coal in concentrated acids such as HF and HCl. After the removal of minerals in the coal authors studied only diffraction profile of the strongest plane (002) of carbon by differentiating on the aliphatic and aromatic part. Aromatic ring stacking is closer the d002 value of graphite. Parameter aromaticity fa, which perfectly correlates with the petrographic parameter Cdaf, was calculated from the obtained integral values [4, 5].
The aim of our research was to find the structural parameters of carbon directly from the measured diffraction pattern without the leaching of the coal in concentrated acids. For this purpose Rietveld method was used. Diffraction patterns of selected samples of coal were refined in the TOPAS software in the way that the differentiation of the carbon on aliphatic and aromatic part was obtained by defining two structures of carbon, Fig. 1. By this way we were able to obtain mass portions of aliphatic and aromatic components of carbon in coal with refined lattice parameters, interlayer distance and crystalline size. These parameters perfectly correlate between each other. The graph in Fig. 2 shows the relation of interlayer distance d002 on mass portion of carbon. Both trend lines are directed to the amount of 50 % at standard value of d002 = 0.335 nm what is a perfect coal and thus graphite in the limit.
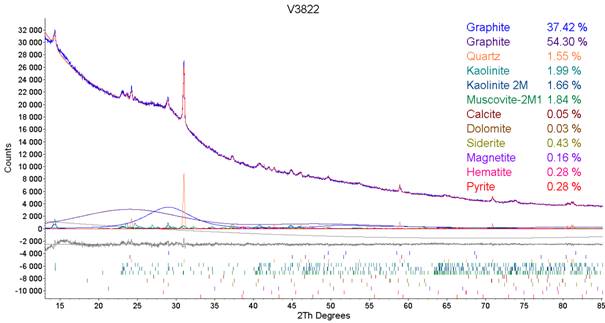
Figure 1. Detail of the refined diffraction pattern.
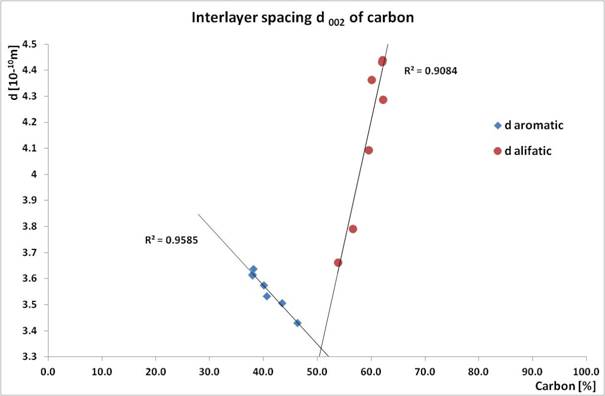
Figure 2. Interlayer daromatic and daliphatic vs. carbon content of coal.
Table 1. General phase composition of the analyzed coal samples.
|
Identified phase composition |
Average |
Min |
Max |
||
|
chemical Formula |
Mineralogical name |
Space Group |
Content [wt %] |
Content [wt %] |
Content [wt %] |
|
C |
Graphite |
(166) R-3m |
93.7 |
83.9 |
93.7 |
|
SiO2 |
Quartz |
(152) P3121 |
3.1 |
0.5 |
3.1 |
|
Al2(Si2O5)(OH)4 |
Kaolinite 2M |
(001) P1 |
5.3 |
1.4 |
5.3 |
|
Al2(Si2O5)(OH)4 |
Kaolinite |
(001) P1 |
2.4 |
0.2 |
2.4 |
|
(K,Na)Al2(Si,Al)4O10(OH)2 |
Muscovite 2M1 |
(015) C12/c1 |
4.6 |
0.9 |
4.6 |
|
FeS2 |
Pyrite |
(205) Pa-3 |
0.9 |
0.1 |
0.9 |
|
CaCO3 |
Calcite |
(167) R-3c |
1.5 |
0 |
1.5 |
|
MgCaCO3 |
Dolomite |
(148) R-3 |
2.2 |
0 |
2.2 |
|
FeCO3 |
Siderite |
(167) R-3c |
1.1 |
0 |
1.1 |
|
Fe3O4 |
Magnetite |
(227) Fd-3m |
2.4 |
0.1 |
2.4 |
|
Fe2O3 |
Hematite |
(167) R-3c |
0.4 |
0 |
0.4 |
1 I. Siddigui, M.T. Shah, I. Ahmed: X-Ray Diffraction Analyses of Thar, Sonda and Meting - Jhimpir Coalfields, Sindh; Sind Univ. Res. Jour Vol. 41 (2009) p. 67-74
2 R. S. Winburn, S. L. Lerach, B.R. Jarabek, M.A. Wisdom, D.G. Grier, G.J. McCarthy: Quantitative XRD Analysis of Coal Combustion By-Product by the Rietveld Method, JCPDS Internation Centre for Diffraction Dta 2000, Advances in X-ray Analysis, Vol. 42, p. 387-396
3 C.R. ward, D.French: Relatin between Coal and Fly Ash Mineralogy, Based on Qualitative X-ray Diffraction Methods, World of Coal Ash (WOCA), April 11-15, 2005, Lexington, Kentucky, USA
4 B. Mamoj, A.G. Kunjomana: Study of Stacking Structure of Amorphous Carbon by X-ray Diffraction Technique; Int. J. Electrochem. Sci. 7 (2012) p. 3127-3134
5 P. Boral, A.K. Varma, S. Maity: X-Ray Diffraction Studies of Some Structurally Modified Indian Coal and Their Correlation with Petrographic Parameters; Current Science, Vol. 108, No. 3, (2015) p. 384-394