Stucture refinement from data acquired by electron diffraction tomography
L. Palatinus, M. Klementová
Institute of Physics of the ASCR, v.v.i, Na Slovance 2, 18221 Praha 8
palat@fzu.cz
Introduction
Structure refinement from X-ray diffraction data is a well-established method used routinely in many laboratories around the world. In contrary, structure refinement from electron diffraction data is generally considered difficult, cumbersome and restricted only to special cases. Last decade of development in the field of electron crystallography has shown, however that it is possible to solve and refine crystal structures from electron diffraction data in a way analogical to the procedures used in X-ray crystallography. Very recent progress in combining structure refinement with calculations using dynamical diffraction theory shows that such refinements have the potential to approach – although probably not yet reach – the accuracy and reliability of X-ray structure refinement. The important advantage is that the data collection can be performed on nanocrystals only a few tens of nanometers in size. This article describes the procedure from the data collection through data processing to the structure solution and refinement, pointing out the similarities and differences to the process of structure determination from X-ray diffraction data that is familiar to most practicing crystallographers.
Experiment
Electron diffraction experiments on micro- and nanocrystals are performed in a transmission electron microscope. Traditionally, electron diffraction patterns were collected from oriented crystals. However, this technique is time consuming and it is difficult to collect sufficiently complete data using only oriented patterns. An alternative is to use the method of rotating crystal that is customary in X-ray diffraction experiments. In the field of electron crystallography this method is called electron diffraction tomography (EDT [1,2]). A (non-oriented) crystal is tilted around the goniometer axis in small steps (typically 0.5 or 1°, but sometimes much smaller), and a diffraction pattern is recorded after every step on an area detector, typically a CCD camera. The electron microscope thus acts as a single-circle diffractometer with area detector.
The intensity of reflections is critically dependent on the exact orientation of the crystal. This makes the interpretation of the intensities difficult. A technique called precession electron diffraction (PED, [3]) partly removes this effect. The principle of the method is illustrated in Fig. 1. The incident electron beam is precessed around a cone with vertex on the sample and with the opening semiangle typically between 1° and 2°. The resulting diffraction pattern is then an integral over all directions of the incident beam along the cone. This technique greatly decreases the sensitivity of the diffracted intensities to the crystal orientation and on other nuisance parameters like crystal thickness and its variation. This makes the combination of PED with EDT a powerful method for crystallographic data collection.
The tilt range of the crystal in the microscope is limited by the construction of the microscope, and represents the most serious limitation of the technique. On some microscopes with some sample holders the tilt range is limited to only ±20° or even less. Such microscopes are unsuitable for collecting electron tomography data. On the other hand, some microscopes equipped with specialized tomographic sample holders allow for an almost complete ±90° tilt, and thus collection of almost a full sphere of data.
The goniometers are usually not sufficiently stable to hold the nanocrystals at a constant position during the whole data collection. Therefore it is necessary to either reposition the crystal during the experiment, or shift the beam to follow the movement of the crystal. This can be achieved manually or automatically using image analysis. The whole diffraction experiment takes usually between 15 and 60 minutes depending on the tilt range, exposure time and crystal tracking procedure.
Data processing
Once recorded, the data can be processed in a way very similar to the procedures used in X-ray diffractometer software, i.e. the frames are analyzed for maxima, which are stored in a “peak table” and subsequently used for finding the unit cell and orientation matrix. This matrix is then used to predict the position of all reflections on the diffraction patterns, and integrate their intensities.
Two issues require special attention. First, the electron optics is not perfectly stable, and therefore the position of the center of the diffraction pattern may slightly change during the experiment. The data processing must therefore track the position of the primary beam. This may be non-trivial, because the primary beam is often covered by a beam stop to prevent damaging the detector by overexposure. The center can then be determined only from the positions of the Friedel pairs in the image, or by cross-correlation of subsequently recorded images.
The second issue is the position of the tilt axis. Again due to the variability in the electron optics, the projection of the tilt axis on the diffraction pattern need not be constant for every experiment. It is thus a variable that needs to be refined during data processing. The technique typically used for this purpose is the autoconvolution of the set of extracted peak positions recalculated to the 3D coordinates in reciprocal space. If the peak positions form a lattice, then their autoconvolution also forms a lattice. The peaks form an undistorted lattice only if the tilt axis is correctly determined, and this property can be used to refine the tilt axis. An example of an autoconvolution using correct and incorrect tilt-axis position is given in Fig. 2.
Structure solution and kinematical refinement
As in previous sections, the basic principles of structure solution from electron diffraction data are the same as for X-ray diffraction data. The list of reflection indices with integrated intensities is submitted to a structure solution program that solves the phase problem by one of the established methods – direct methods, dual space methods or direct space methods. The difference is in the quality of the solution. While X-ray diffraction data often provide complete solutions that can be directly submitted to refinement process, electron diffraction data, being less complete and much noisier (in the sense “deviating from the expected proportionality between intensity and structure factor squared”) often result in partial solutions that require intervention of a crystallographer. However, most often the solutions are sufficiently good to allow finding the correct structure.
The structure refinement is the most problematic part of structure analysis from EDT data. The least-squares refinement can be performed against electron diffraction data using the kinematical approximation (i.e. using the assumption that the structure factor amplitude is proportional to the square root of the diffracted intensity). However, this approximation is very inaccurate due to the deviations from the kinematical diffraction theory caused by multiple scattering. As a result, the refined structures yield high R-values (R1 typically between 20 and 30%), inaccurate results (deviations from the correct atomic positions typically up to 0.2 Å, but sometimes more), and non-reliable estimates of the uncertainties of the refined parameters. Despite of these problems, kinematical refinement is used with EDT data, because it is easily accessible in several refinement programs, and it provides a quick estimate of the correctness of the determined structure. For many applications, where it is the connectivity that is of interest and not the accurate atomic positions, kinematical refinement provides sufficient information.
Dynamical structure refinement
An obvious remedy to the deficiencies of the kinematical refinement is to use the correct dynamical theory to calculate the expected diffracted intensities from a model structure. The underlying theory has been developed long time ago (see e.g. [4] for an overview), but the practical application was hampered by several technical problems. First of all, the dynamical diffraction theory is a many beam theory, and the intensity calculations require exponentiation of a large matrix, and are thus quite time consuming. A more serious problem is, however, that the calculated intensities are very sensitive to the crystal orientation and thickness. If the crystal is slightly mosaic, bent, or has irregular shape, the experimental intensities will strongly deviate from the theoretical calculation, which assumes a perfect crystal. A remedy to this problem is to use PED data. As already mentioned, such data are less sensitive to crystal imperfection, crystal orientation and details of the crystal shape. It is thus possible to calculate PED intensities to a better accuracy [5]. Table 1 shows a comparison of a structure refinement on pyroxene EDT data.
Conclusion
The progress in structure determination from electron diffraction data achieved over the last decade was enormous. A series of developments changed this approach from an exotic and specialized to commonly accepted and widely used. The methodological development is by no means finished, but it has reached such a state of maturity that structures can be solved from electron diffraction data by almost anybody with access to a suitable transmission electron microscope and with basic crystallographic education.
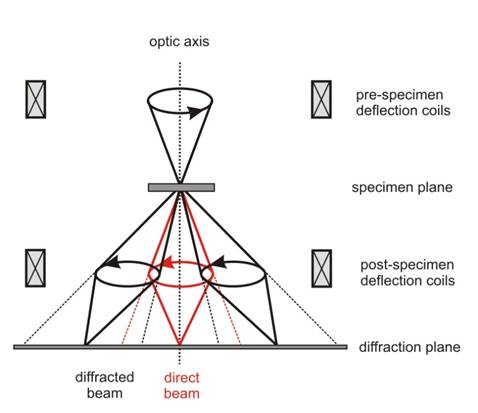
Figure 1. The principle of the precession electron diffraction technique. The incident beam is deflected by pre-specimen deflection coils to make a precessing motion (scan). The diffraction pattern is then focused back to the original position by post-specimen deflection coils (descan).
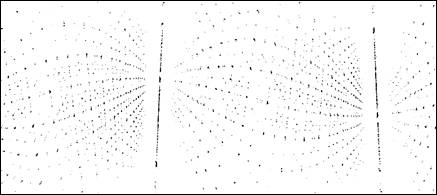
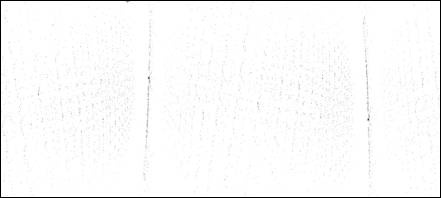
Figure 2. Cylindric projection of the distribution of points in the autoconvolution pattern using the correct (top) and 10° off-set (bottom) tilt axis position.
Table 1. Preliminary results from the refinement of the structure of orthopyroxene (Fe,Mg)2Si2O6
using kinematical and dynamical difraxction theory. Precssion angle 2.0°. Data courtesy of
Damien Jacob and Priscille Cuvillier,
University of Lille.
|
|
Kinematical refinement |
Dynamical refinement |
|
R1 [%] |
24.4 |
9.3 |
|
Average atomic distance from reference struture [Å] |
0.042 |
0.018 |
|
Maximum atomic distance from reference structure [Å] |
0.070 |
0.035 |
References
1. U. Kolb, T. Gorelik, C. Kübel, M. T. Otten,
D. Hubert, Ultramicroscopy, 107, (2007), 507-513.
2. D. Zhang, P. Oleynikov, S. Hovmöller, X.
Zou, Z. Kristallogr., 225, (2010), 94-102.
3. R. Vincent, P. A. Midgley, Ultramicroscopy, 53, (1994), 271-282.
4. J. Spence, J. M. Zuo, Electron microdiffraction. New York: Plenum Press. 1992.
5. L. Palatinus, D. Jacob, P. Cuvillier, M.
Klementová, W. Sinkler, L. D. Marks, Acta
Cryst A, 69, (2013), 171-188.
Acknowledgements.
A part of this work was supported by the Grant Agency of the Czech Republic, grant number 13-25747S.