auxiliary programs for
diffraction experiments
Jiří Čapek1,
a, Zdenek Pala1, 2
1Department of Solid State
Engineering, Faculty of Nuclear Sciences and Physical Engineering, Czech
Technical University in Prague
2Institute of Plasma Physics, Academy
of Sciences of the Czech Republic
acapekjir@fjfi.cvut.cz
Because of recurring pleas of
colleagues who are frequent users of X-ray diffraction results and who wanted
to know the relevant volume of material which was irradiated, programs for
calculation of penetration depth and linear absorption coefficients of
crystalline phases were written in MatLab environment. In addition to it, we
were often faced with oddly positioned Debye rings obtained in back reflection
experiment. Debye rings’ convenient location on area, 2D, detector was, thus,
achieved by repeatedly performing the experiments. That had led us to create a
program which would visualize the outcome for selected experimental parameters.
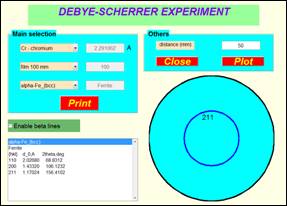
Debye software was created as a visual aid for users
doing the so called the back reflection experiment (or backscattering
Debye-Scherrer experiment) [1]. It is a basic method for qualitative
determination of real structure of materials. In materials only planes, which
are oriented in the manner satisfying the Braggs’ law, can diffract. The
diffracted radiation has a character of diffraction cones with the apex angle
of 4θ. If this diffracted radiation impacts on a 2D detector, the so
called Debye rings are detected. The user can make a model of the experiment
upon changing the experimental parameters and also can check an expected result
for untextured polycrystalline fine-grained materials. This is especially
helpful for setting the right distance between the irradiated sample and 2D detector
when the dimension of the detector is known. In Fig. 1, there is the result for
standard alpha-ferrite steel in the distance of 50 mm from the detector when
radiation from X-ray tube with chromium anode is used.
|
|
|
|
Figure 1. User interface of the debye software. |
Figure 2. User interface of the absorption coefficient software. |
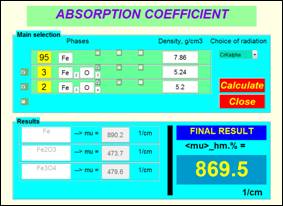
Absorption coefficient software was created because
it is de rigueur to know the values of linear absorption/attenuation
coefficients when the penetration depth is to be calculated since it describes
the reduction of an energy beam upon passing through a specific material [2].
For calculation of a linear absorption coefficient it is necessary to know the
amount of each phase in material, densities and chemical formulas of the
phases. In Fig. 2, there is the user interface of the program with the result
of alpha-ferrite steel with oxidation layer (again for CrKα radiation). This constant is subsequently applied in the
calculation of corresponding penetration depth as seen in Fig. 3.
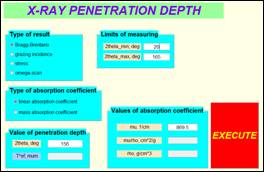
X-ray penetration depth software was created because
the users of XRD results must be informed about the volume of the material to
which the results are relevant. Irradiated volume is given by irradiated
surface, defined by experimental set-up and the inserted slits, multiplied by
penetration depth. Most commonly, the penetration depth is represented by
values of the so called effective
penetration depth Tef which defines the thickness of surface
layer that gives rise to 63 % of diffracted intensity [1]. Hence, this software provides the opportunity to
furnish users with Tef values,
or courses, for the given radiation penetrating the irradiated material. Final
values generally depend on an incidence, a rebound angle and on an absorption
coefficient. The user can choose between four types of experimental set-up.
Except for standard Bragg-Brentano geometry and grazing incidence diffraction,
courses of Tef during
residual-stress-aimed diffraction experiment for ω diffractometer can be
visualized for all measured tilts and Tef
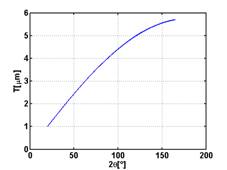
for ω-scans can be plotted as well [3]. User interface of this program
is in Fig. 3 on the left while on the right; there is the result of Tef course for linear
absorption coefficient calculated above and Bragg-Brentano geometry.
|
|
|
|
Figure 3. User interface of the X-ray penetration depth software. |
|
The programs are available for users who have at their disposal MatLab
from http://electron.fjfi.cvut.cz/drupal/software-laborator-strukturni-rentgenografie.
1.
I.
Kraus, N. Ganev, Difrakční analýza mechanických
napětí. Praha: ČVUT, 1995. ISBN 80-01-01366-9.
2.
B.
D. Cullity, S. R. Stock, Elements of
X-ray Diffraction. New Jersey: Prentice Hall, 2001. ISBN 0-201-61091-4.
3.
M.
Birkholz, Thin Film Analysis by X-ray
Scattering. Weinheim: WILEY-VCH, 2006. ISBN 978-3-527-31052-4.
This work was supported by the Grant Agency of the
Czech Technical University in Prague, grant No. SGS13/219/OHK4/3T/14.