Kinetic Monte Carlo simulation of growth of Ge quantum dot multilayers with
amorphous matrix
J. Endres1, S. Daniš1, V. Holý1, M. Mixa1, M. Buljan2
1Charles University in Prague, Faculty of
Mathematics and Physics, Prague, Czech Republic
2Rudjer Boskovic
Institute, Zagreb, Croatia
endres.jan@google.com
Quantum
dot (QD) multilayers with amorphous matrix are
intensively studied because of their physical properties. Due to the size of
QDs many quantum effects are observable for these systems, what can be used for
many technical applications. Possible applications of QD multilayers
are lasers, solar cells, photodetectors or high-speed
memories.
Former
studies were focused on systems with crystalline matrix [1, 2]. These systems
are predominantly prepared by Stranski-Krastanow
growth. At first thin strained wetting layer is grown, until it is
energetically preferred to relieve elastic energy by creating QDs. The cover
layer is then deposited onto the QD layer and the growth can continue with
other wetting layer.
QD multilayers with amorphous matrix are mainly prepared by
deposition on substrate via magnetron sputtering [3-6]. Samples consist of
altering layers of QDs and matrix material. QDs layer is deposited first
(material of QDs can be deposited in the same time as matrix material). Then
this deposited layer is overlaid by cover layer consisting only matrix
material.
Self-ordering of QDs was observed in both types of systems [1-6].
The ordering in multilayer originates in preferential nucleation of QDs during
the growth in the minima of the chemical potential (i.e. surface energy) on the
surface of the cover or wetting layer. In the case of the systems with crystalline matrix the driving force
for self-ordering is elastic strain field originates from mismatch of lattices
of materials in wetting and cover layers. However, there is no strain in multilayers with amorphous matrix. In such systems
self-ordering is caused only by surface morphology of the cover layers. Two
types of stacking of neighbouring layers of QDs (ABC,
ABA) were observed in systems of Ge QDs in different
amorphous matrix (SiO2, resp. Al2O3), see [4-6]. Finding the conditions which leads to these
types of stacking was target of performed simulations.
Chemical potential at point on surface x = (x,y) is given as [7]
![]() (1)
(1)
where μ is a constant reference value of
the chemical potential, w is the
volume density of elastic energy, γ
is the surface tension, κ is the
surface curvature and V0
is the atomic volume. Due to the amorphous matrix there is no strain in the
multilayer and the second term in equation (1) is thus zero and chemical
potential depends only on the curvature (i.e. morphology) of the surface of
cover layer.
We consider that the surface shape is originated from deposition of cover layer over the QDs when a hill of material is created above each QD. Multilayer and dots can be described by three indexes j1, j2, j3. Index j3 denotes the position of layer in the z axis direction with zero at substrate and oriented to sample surface. This index is used for both dot and corresponding cover layer. Indexes j1 and j2 then label dots in x and y axes direction in the given layer j3. For the shape of these hills on the surface of cover layer j3 we use function [4]
![]() (2)
(2)
where x = (x,y) is point on surface, Xj1,j2,j3-1 and Xj1,j2,j3-2 are positions of QDs in layers j3-1 and j3-2, parameter C is inheritance factor which determines the contribution of height of interlayer surface above QDs layer j3-2 and f(x) is Gauss function
![]() (3)
(3)
where σ is a parameter determining full
width at half maximum. When inheritance factor C is greater than 0, surface height is affected not only by last
layer but also by one lower layer, which can cause ordering of QDs in vertical
direction.
Simulation
of the growth can be performed by Kinetic Monte Carlo (KMC) method. Simulation
model was based on several processes which can occur [2]. The adatoms can be deposited onto the surface, adatoms can diffuse on it, adatoms can join into the QD or can escape it. Adatoms are moving by thermally activated hopping between
neighboring sites of square discrete simulation lattice. The size of the whole
lattice has to be big enough to not be affected by edge effects of finite-size
simulation lattice. Periodic boundary conditions are considered during
simulation, so if some adatom leaves the simulation
area, it reappears on the opposite side. After the completed growth of actual
layer the surface of cover layer was computed as hills (defined by analytical
functions) over buried dots. This surface shape was used to determine the
curvature chemical potential which serves as driven force for simulation of
next layer [4].
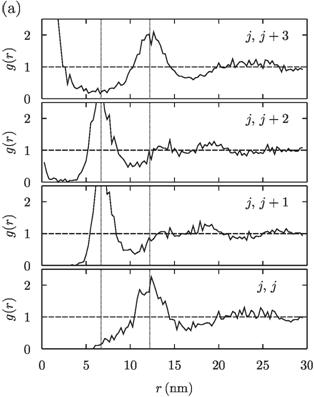
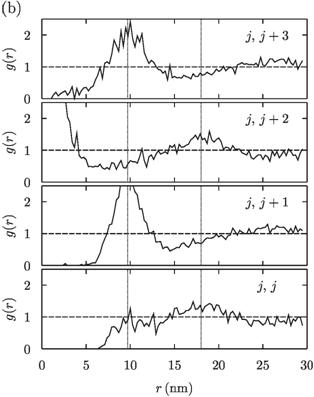
To
analyze the correlation of distances between QDs in lateral direction we used
the radial distribution function (RDF). It describes the probability of finding
the center of a particle at given lateral distance from the center of another
particle. This function can be evaluated for QDs in one layer to determine the
lateral ordering in one layer or between chosen layer l and next three layers j +
1,2,3 to determine the ordering of the dots in vertical direction (type of
layers stacking, ABC or ABA).
In the
case of partially ordered layer of QDs the RDF should have the first highest
maximum at the position rm,
which correspond with the distance of the first shell of dots around the center
dot and can be considered as the most probable distance between all neighbouring dots. In dependence of the degree of ordering,
we can seed other lower maximums, which correspond with next shells of dots.
In the
case of ABA stacking QDs in layer j+2
is aligned above dots in layer j, for
ABC type stacked layers j + 1,2 are
offset and layer j + 3 is aligned
above dots in layer j. So the ABC
stacking correspond with the first maximum of RDF for layer j + 1,2 at
about one half of distance rm.
The maximums of RDF for layer j + 3
are at 0 and at rm
again. In the case of ABA stacking the first maximum of RDF for layer j + 1 is at
about one half of rm
and maximums for layer j + 2 are at 0
and rm.
In performed simulations we observed the
short-range lateral self-ordering in particular layers. This ordering (with
size of the dots and distance between them) can be influenced by parameters of
deposition, like temperature, deposition flux or volume of deposited material.
The ordering in vertical direction can be tuned by changing of properties of
surface morphology, e.g. the parameters of functions describing the hills over
dots like width or inheritance factor.
The different types of stacking order of quantum dot layers (ABC or ABA) were observed, see Fig. 1. RDF corresponding with ABC stacking is in Fig. 1(a). As was mentioned above we see maximum in RDF of positions of dots in layer j = 20 at distance approximately rm = 12 nm. For RDF for dots between layers j and j + 1,2 we see maxim at approximately 7 nm. And for RDF for dots between layers j and j+3 we see maxima at 0 and 12 nm. RDF corresponding with ABA stacking is in Fig. 1(b). Maximum in RDF of positions of dots in layer j = 20 at distance approximately rm = 18 nm. Maximum at the same position is also in part of RDF for layer j + 2 (he we see maximum at 0 too). Maxima at approximately 10 nm are visible at RDF for layers j + 1,2.
|
|
|
|
Figure 2. Radial distribution functions for dots in layer j = 20 and dots in layers j, j+1,
j+2, j+3 for system with (a) inheritance factor C = 0.5 and narrower Gauss functions of surface shape and (b) C = 0.0 and broader Gauss functions
for determining the shape of cover layer surface. Value of 1 (value in the
infinity distance) is marked by dashed line and positions of maxima
determining the distance of nearest neighbor dots by dotted line. Positions
of maxima reveal that in case (a) the stacking order of the layers is ABC and
in the case (b) it is ABA. For detailed description see the text. |
|
1. J. Stangl, V. Holý, G. Bauer, Rev.
Mod. Phys., 76, (2004), 725.
2. M. Mixa, V. Holý, G. Springholz, G. Bauer, Phys.
Rev. B, 80, (2009), 045325.
3. M. Buljan, U. V. Desnica, G. Dražić, M. Ivanda, N. Radić, P. Dubček, K. Salamon, S. Bernstorff, V Holý, Nanotechnology, 20, (2009), 085612.
4. M. Buljan, U. V. Desnica, M. Ivanda, N. Radić, P. Dubček, G. Dražić, K. Salamon, S. Bernstorff, V. Holý, Phys. Rev. B, 79, (2009), 035310.
5. M. Buljan, S. R. C. Pinto, A. G. Rolo,
J. Martínn-Sanchez, M. J. Gomez, J. Grenzer, A. Mücklich, S.
Bernstorff, V. Holý, Phys. Rev. B, 82,
(2010), 235407.
6. M. Buljan, N. Radić, M. Ivanda, I. Bogdanović-Radović, M.
Karlušić1, J. Grenzer, S. Prucnal,
G. Dražić, G. Pletikapić,
V. Svetličić, M. Jerčinović,
S. Bernstorff, and V Holý, J. Nanopart. Res., 15,
(2013), 1485.
7. H. Gao, J. Mech. Phys. Solids, 42, (1994), 741.