Modelling
effects of small crystallite size and lattice defects on powder diffraction
lines
Z. Matěj, R. Kužel
Department
of Condensed Matter Physics, Faculty of Mathematics and Physics,
Charles
University in Prague, Ke Karlovu
5, 121 16 Praha 2, Czech Republic
matej@karlov.mff.cuni.cz
Introduction
X-ray
powder diffraction (XRD) techniques are very appropriate for characterisation
of various materials as non-destructive and containing rich information on
phase composition, lattice parameters, crystal structure and other aspects of
material structure on nanometre and submicrometre
scale, which can be related to application properties and hence to be also of technological
interest. Presence of lattice defects, their type and concentration as well as
crystallite size can be determined from width and shape of diffraction lines.
The aim of this contribution is to give a short overview of classical
approaches of a line profile analysis (LPA) complemented with methods based on
simulations and fitting of whole diffraction patterns advanced during the last
decade. The theoretical summary is supplemented with some practical examples.
Direct and
whole profile modelling techniques
Already at
the birth of the XRD analysis Scherrer (1918) [1] utilized a simple relation between
diffraction peak width and particle size. Variations of the lattice parameter
between individual crystallites or lattice deformations around defects were then
included in the Williamson-Hall plot
method [1], which links information from multiple hkl reflections to separate the
size and strain related broadening effects. Fourier transformation of intensity
data and again the analysis of reflections of different order are the basis of
the Warren-Averbach
method [1]. This technique can reveal finer details in the real space without
preliminary assumptions about the microstructure model.
|
|
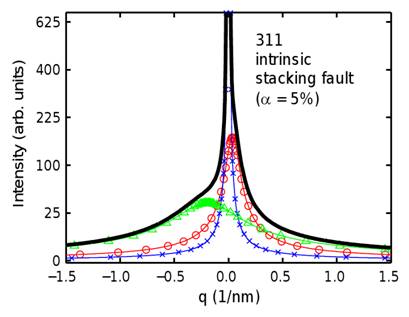
Figure
1.
Simulated diffraction profile for a fcc copper polycrystalline specimen with intrinsic
stacking faults. 311 reflection, stacking fault probability a = 0.05. Thick black line
depicts the whole diffraction profile. Colour lines show its subcomponents.
The stacking fault effect was convoluted with size broadening to avoid the
delta peak from unaffected components. Crystallites size was set to D ~ 200 nm. Similar
figure can be seen in Balogh et al. [4]. (q = 4p sin Q / l) |
Generally
any LPA method introduces some approximations and indeed some of them require
ill-posed steps, such us deconvolution. A common attribute
of all the methods mentioned is that reflections in the powder pattern are
analysed separately, which becomes problematic due to strong peak overlap especially
in the case of nanocrystalline or low symmetry
materials. It can be solved by introduction of the Rietveld method. All peaks in the diffraction pattern are fitted
simultaneously on a basis of some model, which parameters are refined. Most of
models used also by direct methods can be generalised and adapted also for the Rietveld technique. E.g. anisotropy (hkl dependence) of peak
broadening can be accounted for any type of crystal symmetry [2,3]. For computational simplicity analytical profile
function, e.g. pseudo-Voigt function, are utilized to describe peak profiles in
the classical Rietveld programs. Nevertheless in many
cases, see Fig. 1 showing peak broadening in fcc
metal sample induced by stacking fault defects [4], peak shape can be quite
complex. Hence it was proposed by Scardi&Leoni
(2000) [5] and Ribárik&Ungár [6] to simulate
shape of diffraction profiles from a microstructural
model suitable for a particular material and problem under investigation. This
technique of the whole powder pattern
modelling (WPPM) makes it possible to determine e.g. stacking fault
probabilities or dislocation densities in severely deformed (SPD) metals [6].
At first the
WPPM method was applied to some model cubic [5-6] or hexagonal materials.
However, as in the last decade mainly nano-materials
stay in the centre of interest, validity of an additional approximation present
also in WPPM was discussed. This important assumption is known in Warren [1] as
a “powder diffraction theorem” or in Beyerlein (2011)
[7] as a “tangent plane approximation”. The problem can be intrinsically solved
if the powder pattern is calculated from the atomistic model using a well known
Debye formula. This technique can be used for
calculation of scattering from various nano-objects
as nanotubues [8] etc., but it is hardly scalable to
larger 3D objects because of its computational complexity.
Lattice
defects
In WPPM the
microstructural models are usually build in the real
space, where Fourier coefficients are derived and the profile is calculated by
means of Fourier transformation. In this contribution a formalism introduced by
Wilkens [9] and Krivoglaz&Ryaboshapka
[10] for dislocation induced broadening
will be briefly presented. Its application will be demonstrated on SPD copper samples and nanocrystalline metal samples, where also stacking
fault defects (Fig. 1) play an important role.
|
|
|
|
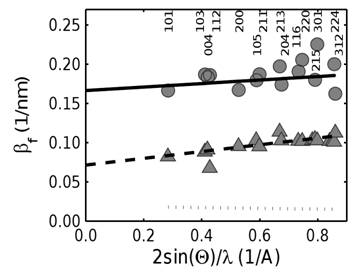
Figure 2.
Williamson-Hall plot of a TiO2 sample prepared by hydrolysis of n-butoxide [11]
at temperature 300 °C (circles) and at 450 °C (triangles). The integral breadths of anatase
reflection with instrumental broadening already deconvoluted
are plotted. It has to be also considered that there is a very strong peak
overlap - especially for the sample prepared at 300 °C (see Fig. 4). |
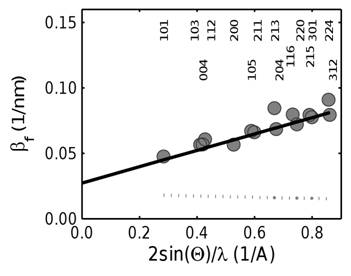
Figure 3.
Williamson-Hall plot of a TiO2 sample prepared by hydrolysis of isopropoxide [11] at temperature 400 °C. A significant microstrain broadening is evident. |
Nanostructures and size effects
Determination
of crystallite size distribution will
be illustrated on model TiO2
samples prepared by different chemical routes. Nevertheless in these
samples the broadening effect is dominating (Fig. 2), it should be borne in
mind that also presence of microstrain can not be
always neglected (Fig. 3). A pattern fit of a model samples is depicted in Fig.
4. Beside the approximations mentioned above also an effect of crystallite shape will be discussed (Fig.
5).
Other
effects
When
compared to the direct methods analysing reflections separately, the whole
powder pattern modelling techniques have also a significant drawback. There is complex
information encoded by nature in the experimental pattern. The direct methods
can simply separate individual effects, by neglecting their mutual influence in
the analysis, e.g. it is assumed that reflection position is not related to its
width and shape. Contrary the whole pattern fitting procedure has to account
for several effects mixed together to reach good pattern fit and reliable
results. Background scattering, residual
stresses and texture have to be also
included.
Computer
programs
There are
many computer programs suitable for
modelling powder diffraction profiles. Some of them (PM2k [12], Maud [13] and MStruct [14]) will be briefly introduced.
|
|
|
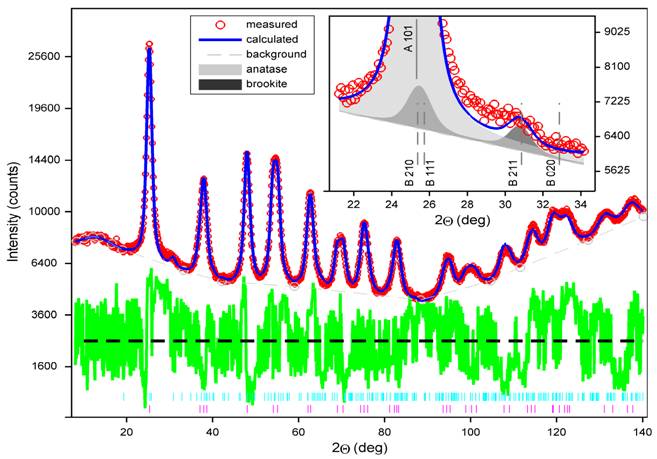
Figure
4. Pattern fit of
a TiO2 sample prepared by hydrolysis of n-butoxide at temperature 300 °C [11]. Small magenta
ticks at the bottom mark the anatase reflections,
whereas the cyan ticks above indicate reflections from the minor phase (here brookite). |
|
|
|
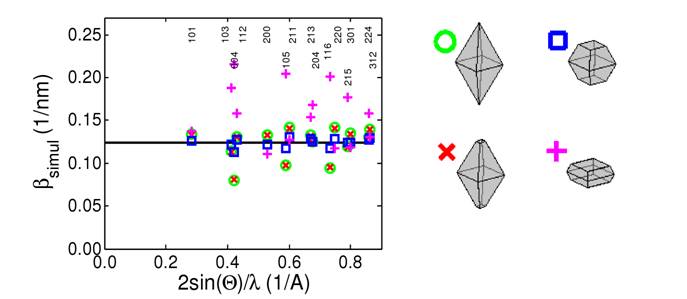
Figure 5. Simulated Williamson-Hall plots for anatase crystallites of bipyramidal
shape and different areas ratio of {101} and {001} facets. It is visible that
some particular configurations (depicted by squares) are hardly
distinguishable from the isotropic one for the spherical crystallites (line). |
References
1. B. E.
Warren, X-ray Diffraction. Addison-Wesley.
1969.
2. N. C. Popa, J.
Appl. Cryst., 31,
(1998), 176.
3. P. W. Stephens, J. Appl.
Cryst., 32, (1999), 281.
4. L. Balogh, G. Ribárik, T. Ungár, J. Appl. Phys., 100, (2006), 023512.
5. P. Scardi, M. Leoni, Acta Cryst. A,
58, (2002), 190.
6. G. Ribárik, T. Ungár,
J. Gubicza, J. Appl. Cryst., 34, (2001), 669.
7. K. R. Beyerlein,
R. L. Snyder, P. Scardi, J. Appl.
Cryst., 44, (2011), 945.
8. T. Brunátová, S. Daniš, R. Kužel, D. Králová, Z. Kristallogr. Proc., 1, (2011), 229.
9. M. Wilkens,
in Fundamental aspects of dislocation
theory, 317, (1970), 1191.
10. M. A. Krivoglaz, X-Ray and Neutron Diffraction in Nonideal Crystals. Springer. 1996.
11. L. Matějová, Z. Matěj,
O. Šolcová, Micro.
Mesoporo.
Materials, 154, (2012), 187.
12. M. Leoni, T. Confente, P. Scardi, Z. Kristallogr. Suppl., 23, (2006), 249.
13. L. Lutterotti, M. Bortolotti, IUCr: Comput. Commission Newsletter, 1, (2003), 43, www.ing.unitn.it/~maud.
14. Z.
Matěj, Materials Struct. Chem. Biol. Phys. Tech., 17-2a, (2010), k99, xray.cz/mstruct.