Charge
density study of tetrazole
L. Kucková, P. Herich,
J. Kožíšek
Department
of Physical Chemistry, Slovak University of Technology, 812 37 Bratislava,
Slovakia
lenka.kuckova@stuba.sk
Introduction
Comparison
of experimental and theoretical electronic structure is very important. In many
cases the number of atoms of the studied system make
difficulties. In this work tetrazole was carefully
chosen as the smallest single molecule in the unit cell. This work deals with
the study of experimental electronic structure of tetrazole.
Tetrazole
and its derivatives have attracted considerable attention because of their characterful structure and their applications as
anti-allergic, antihypertensive, antibiotic and
anticonvulsant agents. Therefore it plays an important role in medicinal
chemistry. Tetrazoles, as quite suitable ligands, can serve as replacement for carboxylic acid also
in supramolecular chemistry. Moreover, tetrazoles are highly flexible ligands
and can easily adapt to different binding modes [1-5].
Experimental
Tetrazole
was purchased from Sigma Aldrich as a solution for reaction. After the solvent
was vaporized, the crystals were prepared by slow crystallization from the
mixture of ethanol – isobutanol (6:1).
A single
crystal of tetrazole was selected and mounted in the
cold nitrogen stream. The data were collected at 100.0 (1) K on an Oxford
Diffraction Kappa geometry GEMINI R diffractometer
equipped with Ruby CCD area detector using graphite monochromated
MoKα radiation (λ=0.71073 Å) at 50 kV and 40 mA.
Distance from crystal to detector was 53 mm. Details of the X-ray diffraction
experiment conditions and the crystallographic data for tetrazole
are given in Tab. 1. Crystal
structure was solved and refined by using SHELXS-97 and SHELXL-97. The
molecular structure of tetrazole and its perspective
view are shown in Fig. 1.
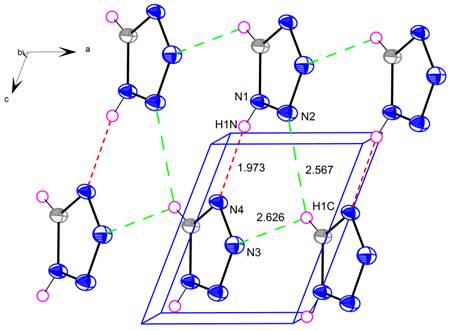
Figure 1. A perspective view of tetrazole (ellipsoids
are drawn in 50 % probability factor). Contact distances and hydrogen bonds are
shown by dotted lines.
Starting
parameters for multiple refinement were taken from a
routine SHELXL refinement and all other refinements were carried out on F using
the XD suite of programs [6]. A complete
atom-centered multipole
refinement was carried out with the nonspherical
atomic electron density given by the equation (1) [7].
rat(r) = Pc rcore(r) + Pv
k3 rvalence(kr) + ![]() k’3 Rl(k’r)
k’3 Rl(k’r) ![]() Plm±dlm±(q,j) (1)
Plm±dlm±(q,j) (1)
The H atoms
were treated with one bond-directed dipole (l = 1), other atoms were refined up
to octapoles. The local coordinate systems to define multipoles were used as follows. For non-hydrogen atoms: x-axis
- direction to the closest atom, y-axis - perpendicular to the x-axis
and oriented towards the second closest atom; for hydrogen atoms: z-axis
- direction to the bonding carbon or nitrogen atom and x-axis -
perpendicular to the z-axis. The strategy for refinement was as
described previously [6]. The results of refinement are summarized in Tab. 2.
Table
1. Crystal data and experimental details for tetrazole.
Empirical
formula
|
C H2 N4 |
Crystal
size
|
0.264 x
0.162 x 0.058 mm
|
Formula
weight
|
70.07
|
θ range for data collection
|
4.68° to 45.59° |
Temperature,
wavelenght
|
293 (2)
K, 0.71073 Å
|
Index
ranges
|
-7<=h<=6 |
Crystal
system, space group
|
triclinic, P 1
|
-9<=k<=9
|
|
Unit
cell dimensions
|
a
= 3.6064 (4) Å
|
-9<=l<=9 |
|
b
= 4.7373 (6) Å
|
Max. and min. transmission
|
0.994 and 0.977
|
|
|
c = 4.9287 (9) Å |
Reflections
collected
|
5398
|
|
|
α = 107.1 (1)° |
Independent
reflections
|
1961 (R(int) =
0.0333) |
|
|
β = 107.8 (2)° |
Completeness
to 2θ = 25.00
|
100% |
|
|
γ = 100.1 (1)° |
Data /
restraints / parameters
|
1961 / 3 / 46 |
|
Formula
units per unit cell
|
1
|
Goodness-of-fit on F^2 1.041 |
1.041 |
Calculated
density
|
1.589
mg m-3 |
Final R indices [I>σ(I)]
R1 = 0.0388, wR2 = 0.0984 |
R1
= 0.0388, wR2 = 0.0984
|
Absorption
coefficient
|
0.124
mm-1
|
R
indices (all data)
|
R1 = 0.0434, wR2 = 0.1034 |
F (000)
|
36
|
Largest diff. peak and hole 0.349
and -0.404 (eÅ-3) |
0.349 and -0.404 (eÅ-3) |
As can be
seen in Table 2, the multipole refinement resulted in
a significant improvement of the agreement between the experimental and
calculated structure factors. Residual density maps were calculated by a
Fourier synthesis where the coefficients are differences between the observed
and calculated structure factors corresponding to the converged multipole model.
Table 2. Summary of the SHELXLand multipole refinement of
tetrazole.
|
|
SHELXL refinement |
Multipole refinement |
|
R(F) |
- |
0.0188 |
|
R(F)† |
- |
0.0191 |
|
wR(F) † |
- |
0.0148 |
|
R(F2) |
0.0388 |
0.0241 |
|
R(F2) † |
0.0434 |
0.0242 |
|
wR(F2) † |
0.1034 |
0.0300 |
|
S |
1.041 |
1.4455 |
The maximum
and minimum of the residual density are +0.108 e/Å3 and −0.074
e/Å3, respectively; the root-mean-square
residual density is 0.034 e/Å3. Atoms in ring are bonded by
covalent bonds. Inspection of the maximum charge concentrations in the bonding
and nonbonding regions in the valence shell, the so-called valence shell charge
concentrations (VSCCs) shows that there are three
charge concentrations (Fig. 2), which correspond to lone electron pairs on
nitrogen atoms. On the other hand, the depletion of the charge in the regions
where the covalent bonds are formed by interaction with the lone pair on carbon
and nitrogen donor atoms (C(1), N(1), N(2), N(3) and N(4)) is clearly seen
(Fig. 2).
Figure 2. 3D plots of the Laplacian of the electron
density in tetrazole.
References
1. R. N. Butter, in Comprehensive
Heterocyclic Chemistry, A. R. Katritzky,
C. W. Rees, Eds., Vol. 5, Part 4A, Pergamon Press, New York, 1984, p. 791
2. S. Bergmans, J. Hunt, A.
Roach, P. Goldsmith, Epilepsy Res. 75 (2007) 18
3. J. H. Toney, P. M. D. Fitzgerald, N. Grover Sharma, S.
H. Olson, W. J. May, J. G. Sundelof, D. E. Venderwall, K. A. Cleary, S. K. Grant, J. K. Wu, J. W. Kozarich, D. L. Pompliano, G. G.
Hammond, Chem. Biol. 5 (1998) 185
4. L. V. Myznikov, A. Hrabalek, G. I. Koldobskii, Chem Heterocycl. Compd.
43 (2007) 1
5. H. D. Klaubert, J. H. Sellstedt, C. J. Guinosso, S. C.
Bell, R. J. Capetola, J. Med. Chem. 24 (1981)
748
6. Koritsanszky, T.; Howard, S.T.; Su, Z.; Mallinson, P.R.; Richter, T.; Hansen, N.K. (1997), XD, Computer Program Package for Multipole Refinement and Analysis of Electron Densities from Diffraction Data. Free University of Berlin, Germany.
7. Coppens, P. X-ray Charge Densities and
Chemical Bonding, Oxford University Press, 1997.
Acknowledgements.
This work has been supported by
Slovak Grant Agency
APVV (APVV-0202-10) and VEGA (1/0679/11).