Structural and morphological properties of Fe2O3/TiO2
nanocrystals in silica matrix
Václav Valeš1,
Václav Holý1, Maja Buljan2, Vesna Janicki2,
and Sigrid Bernstorff3
1 Department of Condensed Matter Physics,
2
Rudjer Boskovic Institute,
3
ELETTRA Sincrotrone
Titania (TiO2)-based
systems have been very intensively studied in last decades because of their photocatalytic activity, which found broad commercial
applications. Functionalized titania
composites, especially Fe2O3/TiO2
systems attracted a lot of attention recently (see [1, 2], among others), since
they make it possible to improve the photocatalytic
performance of titania. The ε-phase of Fe2O3
exhibits a very large magnetic coercivity at room temperature [3] so that Fe2O3/TiO2
in solutions can easily be manipulated by external magnetic field. Fe2O3/TiO2
compact thin layer composites as a photocatalyst can respond to visible light
due to the narrow band-gap of Fe2O3.
We have studied two types of structures, namely (Fe2O3+SiO2)/SiO2
and (Fe2O3+SiO2)/ (TiO2+SiO2)/SiO2
periodic multilayers. Both types of samples were grown by a co-deposition of
the actual material together with SiO2 and pure SiO2 as
an interlayer spacer. The samples have been subsequently annealed for one hour
at various temperatures in air or forming gas (FG – Ar
+ 4% H2). We prepared a large series of samples with various thicknesses,
annealing temperatures and annealing atmospheres in order to find the optimal
conditions of the preparation; here we report only several characteristic
examples, their basic parameters are summarized in Tab. 1. Samples A – F
consist of 10 periods, samples A – C were annealed in forming gas atmosphere,
while samples D – F at the air. Samples that did not contain titania were prepared under various conditions – thickness
of Fe2O3+SiO2 layer from 0.6 nm to 2.0 nm, annealing temperature from 300 °C to 900 °C at air, forming gas, or vacuum. These samples
consisted of 20 periods.
X-ray diffraction curves of
the samples have been measured by laboratory diffractometer with a standard
x-ray tube (CuKa radiation, 1.5 kW)
using a parallel-beam setup. During the measurement the angle of incidence of
the primary beam was kept constant at 1 deg to suppress the substrate signal.
Small-angle x-ray scattering
in grazing incidence geometry (GISAXS method) has been carried out at ELETTRA
synchrotron source (SAXS beamline) using the photon energy of 8 keV. The incidence angle of the x-ray beam was chosen 0.25
deg, i.e. just above the critical angle of total external reflection.
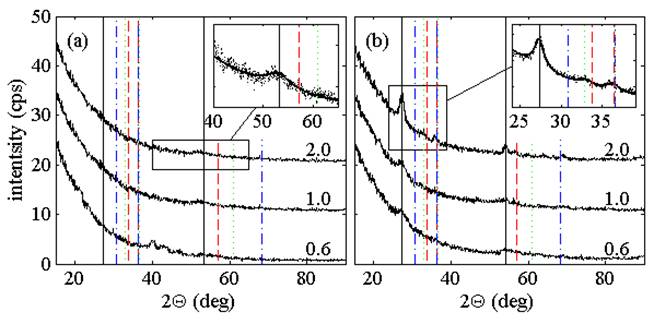
Figure
1. X-ray diffraction curves of samples A, B,
C (a) and D, E, F (b). The insets display the details of the diffraction peaks
along with their fits to theoretical curves (lines). The vertical lines
indicate the theoretical positions of the diffraction peaks for various phases:
black full line – rutile, red dashed line – hematite (a-Fe2O3),
blue dash-dotted line – maghemite (g-Fe2O3),
and green dotted - ε-Fe2O3.
The x-ray diffraction data on
samples without titania
exhibit diffraction maxima neither before, nor after post-growth annealing,
i.e., the Fe2O3
component did not crystallize under the annealing conditions used in this work.
The diffraction curves of samples A-F are presented in Figure 1. From the data
it follows that TiO2 nanoparticles grow during the annealing, from
the positions of their diffraction peaks we identified the tetragonal rutile
phase. More interestingly, in samples E and F we detected also Fe2O3
nanoparticles, however their diffraction maxima are
rather weak, which indicates that the density of these particles is very small.
The positions of the Fe2O3 maxima roughly correspond to
the hexagonal hematite a-Fe2O3
or ε-Fe2O3 phase. We have compared the diffraction
maxima with the simulations based on the Debye-formula approach [2] assuming
spherical particles and from this comparison we estimated the mean particles
sizes (Tab. 1).
Table
1. Parameters of the TiO2-containing
multilayers determined from x-ray diffraction and GISAXS methods, all values
are in nm. d is the nominal thickness
of layers, T is the annealing temperature,
RL, RV are lateral and vertical diameters of particles resp.,
aL,
aV
are mean base lateral and vertical vectors and σL, σV
are their rms.
|
Sample |
d |
T (°C) |
x-ray diffraction |
GISAXS |
||||||
|
RTiO2 |
RFe2O3 |
RL |
RV |
aL |
aV |
sL |
sV |
|||
|
A |
0.6 |
700 |
|
|
1.8 ± 1.0 |
1.8 ± 1.0 |
3 ± 3 |
10.0 ± 0.5 |
2 ± 1 |
5 ± 1 |
|
B |
1.0 |
700 |
|
|
2.5 ± 1.0 |
1.5 ± 1.0 |
3 ± 3 |
11.5 ± 0.5 |
2 ± 1 |
4 ± 1 |
|
C |
2.0 |
700 |
|
|
3.5 ± 1.0 |
1.5 ± 1.0 |
8 ± 3 |
12.5 ± 0.5 |
2 ± 1 |
4 ± 1 |
|
D |
0.6 |
900 |
1.6 ± 1.0 |
|
|
|
|
|
|
|
|
E |
1.0 |
900 |
2.1 ± 1.0 |
|
3.0 ± 0.5 |
2.0 ± 0.5 |
16 ± 5 |
10.0 ± 0.5 |
5 ± 1 |
5 ± 1 |
|
F |
2.0 |
900 |
3.2 ± 1.0 |
2.7 ± 1.0 |
5.0 ± 0.5 |
3.0 ± 0.5 |
16 ± 5 |
11.5 ± 0.5 |
5 ± 1 |
10 ± 1 |
From the fitting of experimental
GISAXS data we found that the (Fe2O3+SiO2)/SiO2
multilayers exhibit no diffraction peaks and no side maxima in GISAXS intensity
maps. Therefore, they remain amorphous and do not form any ordered
structure of amorphous or crystalline particles during post-growth annealing at
temperatures up to 900°C. On the other hand, the
multilayers (Fe2O3+SiO2)/(TiO2+SiO2)/ SiO2 exhibit
both diffraction peaks and GISAXS side maxima after annealing, thus they
contain ordered array of crystalline particles. In these samples, both rutile
TiO2 and hematite a-Fe2O3
are present, the latter with much smaller occurrence. Therefore, the presence
of the TiO2 phase facilitates the crystallization of Fe2O3
during post-growth annealing. Increasing the thicknesses d of the Fe2O3
and TiO2 layers, the mean lateral size of the particles increases;
the vertical size however remains almost constant so that the particles are
disc-shaped for larger d. A similar trend of increasing the lateral
particle size is observed for increasing annealing temperature. The number of
the observed diffraction peaks did not make it possible to determine the
lateral and vertical sizes. The particle size determined from diffraction is
affected by possible deformation of the particle lattice and/or by structural defects,
therefore a detailed comparison of the particle sizes determined from both
methods is not possible. Nevertheless, the particle sizes obtained from x-ray
diffraction and GISAXS data are not in contradiction.
References
1. H. Cui, W. Ren, W. Wang, J. Sol-Gel Sci. Technol. 58, 476 (2011).
2. V.
Valeš, J. Poltierová Vejpravová, V. Holý, V. Tyrpekl, P. Brázda, and S. Doyle,
phys. stat. solidi C 7, 1399 (2010).
3. J. Jin, K.
Hashimoto, and S. Ohkoshi, J. Magn. Magn. Mater. 15, 1067 (2005).
Acknowledgement.
The work was supported by the Czech Science Foundation (project
P204-11-0785) and by the Grant Agency of Charles University in