Fe2O3/SiO2
Nanocomposite – Shape of the e-Fe2O3 Nanocrystals
P. Brázda1, M. Klementová1 and D. Nižňanský2
1Institute of Inorganic Chemistry of
the AS CR, v.v.i., 250 68 Husinec-Řež 1001, Czech Republic
2Dept. Inorg. Chem., Faculty of
Science, Charles University in Prague, Hlavova 8,
12843 Prague 2, Czech Republic
brazda@iic.cas.cz
The
first article dealing with the e-Fe2O3
was published in 1934 [1]. However, its crystal structure described in the
orthorhombic Pna21 was published in 1998 [2]. The structure
of epsilon phase is characterized by the closest packing of the oxygen anions
with ABAC stacking. The stacking planes are parallel to (001). The iron cations
occupy four different sites. Three of them have octahedral and the last one has
tetrahedral coordination polyhedron. The values of the lattice constants are a
= 5.091 Å, b = 8.784 Å and c =
9.472 Å. After a discovery of its giant 2 T room temperature
coercivity in 2005 [3] the epsilon phase attracted more attention as these
properties predestinates it as a promising material for magnetic recording and
information storage. Moreover, in 2009 Namai et al. used this phase as a
high-performance millimeter electromagnetic wave absorber, which opens a
possibility of the applications of this material in high-speed wireless
communication devices [4].
Nanocomposites were prepared by a sol-gel process using complex molecule
of ferric cation and organic molecule H2L bearing two
trimethoxysilyl groups (H2L = bis-[3‑(trimethoxysilyl)propylamide]
of ethylenediaminetetraacetic acid). After hydrolysis and condensation of
Si-OMe groups followed by drying, the xerogels obtained were annealed at final
temperatures between 900 to1100 °C, thus obtaining nanocomposites with 40%
weight concentration of iron oxide [5]. The SiO2 matrix was removed
by reacting the nanocomposite with 5 M NaOH at 80 °C for three days.
The nanocrystals were then washed several times by distilled water and
collected by centrifugation. The transmission electron microscopy (TEM)
measurements were conducted using a JEOL JEM-3010, while the X-ray diffraction (XRD) data were collected using a
PANalytical X’Pert Pro with Cu Ka radiation (λ =
1.5418 Å) at room temperature with the 2θ range between
10° and 110°. Rietveld analyses were performed by the Fullprof program [6]. As
a profile function was used Thompson-Cox-Hastings pseudo-Voigt function. For a
modeling of the anisotropic shape of the crystallites were used spherical
harmonics.
The epsilon phase is stable only in a restricted size range between
approximately 10 to 100 nm. It crystallizes in the Fe2O3/SiO2
system from maghemite and transforms to thermodynamically stable hematite under
prolonged heat treatment. The shape of the epsilon phase crystals depends on
the size of the crystals. The particles obtained at 1100 °C adopt a
disc-like shape flattened in c direction with similar diameters in a
and b directions and they are in almost all cases single crystals. The
largest crystal faces are (001) and (110) as deduced from the HR-TEM images.
These results are in an agreement with XRD data fitting (Figure 1). Table 1
summarizes the volume weighted diameters in the [100], [010] and [001] of the
coherently diffracting domains of the epsilon phase. The fastest growth of the
crystals in the temperature range between 900 °C and 1100 °C is in
the [001] followed by the [100]. The smallest growth is in the [010]. It is
important to note that the viscosity of the silica matrix significantly
increases at about 1000 °C. Under this temperature the growth of the
particles is much slower. To understand this anisotropic growth of the epsilon
crystals it is necessary to understand the basics of the epsilon transformation
from maghemite.
Maghemite has a spinel structure, which is described in the cubic space
group ![]() . The stacking of the oxygen anion layers is along
<111>. The maghemite particles with the size close to 10 nm are
flattened in one of the <111> directions (Figure 2). Some particles
contain domains of both maghemite and epsilon. The contact plane of these
phases was found to be <111>M/[001]e. Evaluation of the FFTs of the HR-TEM images showed that there is a
fixed structural orientation relationship between these two phases (<110>M
is parallel to [010] e and <211>M
is parallel to [100]e, Figure 3). This
orientation relationship is the same as that found by Ding et al. for magnetite
and epsilon [7]. Interestingly, the nanowires of magnetite described in this
work transformed in the epsilon phase only in case when the nanowires grew
along one of the <110> of magnetite (which is the same direction as the
<110> of maghemite), which could explain why is the largest diameter of
the smallest epsilon particles is in the [010]e.
. The stacking of the oxygen anion layers is along
<111>. The maghemite particles with the size close to 10 nm are
flattened in one of the <111> directions (Figure 2). Some particles
contain domains of both maghemite and epsilon. The contact plane of these
phases was found to be <111>M/[001]e. Evaluation of the FFTs of the HR-TEM images showed that there is a
fixed structural orientation relationship between these two phases (<110>M
is parallel to [010] e and <211>M
is parallel to [100]e, Figure 3). This
orientation relationship is the same as that found by Ding et al. for magnetite
and epsilon [7]. Interestingly, the nanowires of magnetite described in this
work transformed in the epsilon phase only in case when the nanowires grew
along one of the <110> of magnetite (which is the same direction as the
<110> of maghemite), which could explain why is the largest diameter of
the smallest epsilon particles is in the [010]e.
In conclusion the transformation of maghemite to epsilon is probably
much faster within a cationic layer than in the direction perpendicular to the
atom stacking as evidenced by the different growing rate of the epsilon phase
in the a, b and c directions.
Figure 1 Comparison of modeled anisotropic
crystal shape (left) with crystals viewed along the corresponding directions in
the HR-TEM images (right) of the sample annealed at 1100 °C.
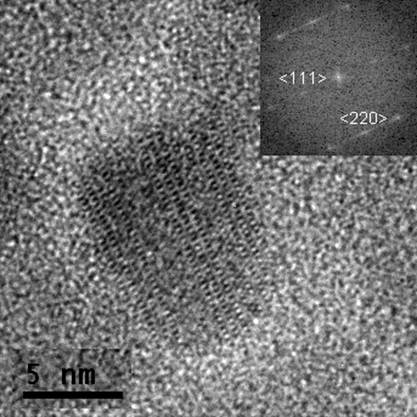
Figure 2 HR-TEM image of a maghemite
particle observed along <211> direction.
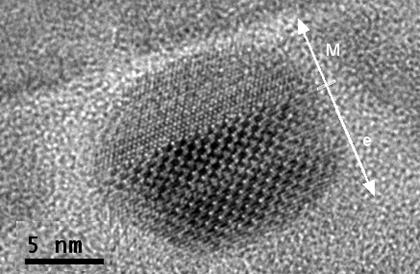
Figure 3 HR-TEM image of a particle
containing both maghemite and epsilon. Arrow points in [111]M and
[001]e. Perpendicular to this direction is
<110>M//[010]e.
Table 1 Volume weighted diameters on e-Fe2O3
as a function of the annealing temperature.
|
Temperature |
[100] |
[010] |
[001] |
|
900 |
6(1) |
11(1) |
3(1) |
|
950 |
10(1) |
10(1) |
5(1) |
|
1050 |
28(2) |
24(2) |
17(2) |
|
1100 |
41(3) |
40(3) |
27(3) |
1. H. Forestier
& G. Guiot-Guillain, C. R. Acad. Sci. (Paris), 199 (1934) 720
2. E. Tronc, C.
Chanéac & J. P. Jolivet, J. Solid State Chem., 139 (1998)
93-104
3. J. Jin, K.
Hashimoto & S. Ohkoshi, J. Mater. Chem., 15 (2005) 1067-1071
4. A.
Namai, S. Sakurai, M. Nakajima, T. Suemoto, K. Matsumoto, M. Goto, S. Sasaki
& S. Ohkoshi, J. Am. Chem. Soc., 131(3) (2009) 1170-1173
5. P. Brázda, D. Nižňanský, J.-L. Rehspringer & J. Poltierová Vejpravová, J.
Sol‑Gel Sci. Technol., 51 (2009) 78-83
6. J.
Rodriguez-Carvajal, Physica B, 192 (1993) 55-69
7. Y. Ding, J. R. Morber, R. L. Snyder & Z. L.,
Wang Adv. Funct. Mater., 17 (2007) 1172-1178