Defect Determination in Epitaxial a-plane GaN Layers
Mykhailo Barchuk,a Václav Holý,a Dominik Kriegner,b
Julian Strangl,b Stephan Schwaiger,c and Ferdinand Scholzc
a Charles University in Prague, Czech Republic.
b Johannes Kepler University, Linz, Austria.
c Ulm University, Germany.
E-mail: mikebarchuk@rambler.ru
Technological applications of optoelectronic devices based on (0001), i.e., c-oriented GaN are complicated by the piezoelectric effect along the [0001] direction. This phenomenon gives rise to a band bending, known as the quantum confined Stark effect [1].
Non-polar or semipolar GaN thin films overcome this problem. However, this type of material possesses a large number of defects, especially stacking faults (SF) so that a reliable method for the determination of the defect densities is of large importance.
We investigate non-polar a-plane oriented GaN epitaxial layers with the (11-20) surface orientation.
In the layers of a-plane GaN, two types of basal
plane stacking faults with the displacement vectors R = 1/6![]() and 1/3
and 1/3![]() are the most typical defects [2]. Another defect types
(extrinsic basal stacking faults with R=1/2(0001), prismatic stacking
faults with R=1/2
are the most typical defects [2]. Another defect types
(extrinsic basal stacking faults with R=1/2(0001), prismatic stacking
faults with R=1/2![]() ) can also occur but their formation energy is significantly
higher so that one can neglect their influence [3].
) can also occur but their formation energy is significantly
higher so that one can neglect their influence [3].
For the detection of SFs by x-ray
diffraction, the visibility criterion can be applied. If g.R
¹ n (g is the diffraction vector, n is an integer), the
diffuse x-ray scattering from the SFs has the form of [0001]-oriented streaks
perpendicular to the fault planes; if g.R
= n the defects are generally invisible by x-ray diffraction [4]. In the latter
case, (for example in ![]() diffraction) a
broadening of the diffraction maximum is observed caused by another defects
such as dislocations, wafer curvature, and surface roughness.
diffraction) a
broadening of the diffraction maximum is observed caused by another defects
such as dislocations, wafer curvature, and surface roughness.
We investigated a series of 4 samples grown by MOVPE technique [5] with various densities of stacking faults.
The x-ray diffraction (XRD) measurements were performed using a custom built rotating anode setup. A double bent parabolic multilayer mirror and a Ge(220) channel cut monochromator were used to produce a parallel beam of CuKα1 radiation. The diffracted radiation was measured by a linear multichannel detector.
The reciprocal space maps of diffracted
intensity were measured in a non-coplanar Bragg geometry. In order to reach the
diffractions ![]() and
and ![]() , in which the visibility criterion is fulfilled, and using
the scattering plane containing the [0001] streak direction, this scattering
plane had to be tilted by 30 deg with respect to the surface normal. In this tilted
plane, diffractions
, in which the visibility criterion is fulfilled, and using
the scattering plane containing the [0001] streak direction, this scattering
plane had to be tilted by 30 deg with respect to the surface normal. In this tilted
plane, diffractions ![]() and
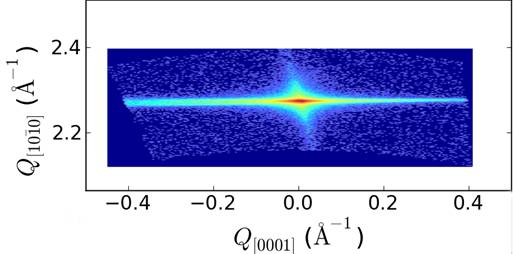
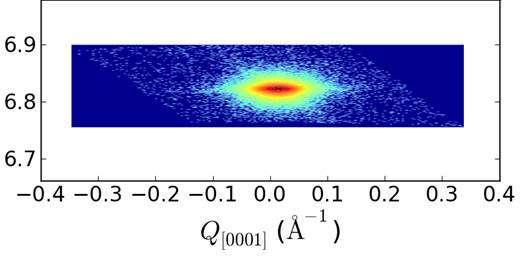
and ![]() are symmetric. In
are symmetric. In ![]() and
and ![]() diffractions we were
able to observe the [0001]-streaks arising from the various types of SFs
(Fig.1). For comparison, we measured also the reciprocal space maps in
diffractions we were
able to observe the [0001]-streaks arising from the various types of SFs
(Fig.1). For comparison, we measured also the reciprocal space maps in ![]() , where the visibility criterion is not fulfilled. In this
diffraction, the SF-related streak does not appear indeed (Fig.1, the right
panel).
, where the visibility criterion is not fulfilled. In this
diffraction, the SF-related streak does not appear indeed (Fig.1, the right
panel).