X-ray
diffraction determination of pearlitic steel properties
(Sledování vlastností pearlitické oceli v rtg. difrakci)
D. Šimek1,
D. Rafaja1, M. Motylenko1, V. Klemm1,
G. Schreiber1,
G. Lehmann2, R. Schmidtchen2, A. Oswald2
1TU-Bergakademie
2TU-Bergakademie
simek@fzu.cz
Introduction
Ferrito-pearlitic
steels are ones of the mostly produced materials for common industrial and
construction purposes. The properties of the steel do not depend only on its
chemical composition, but on the preparation, i.e. the thermo-mechanical
history, leading to a different microstructure. The steel is easily-formable at
higher temperatures (above 911 °C), when the structure of the steel is fcc
cubic (austenite), the recrystallization and recovery takes place and the
deformability is practically unlimited. At lower temperatures, primary ferrite
(bcc cubic) phase starts to nucleate at grain boundaries, expelling the
excessive carbon into the austenite. The amount of primary ferrite depends on the
amount of carbon, on the time for which the material is held above the
eutectoid temperature (727 °C) and on the grain boundary surface too
(cross-section for the diffusion process). The rest austenite decomposes below eutectoid
temperature into a mixture of two stable phases – ferrite and cementite
(orthorhombic Fe3C). The transformation is of displacive nature
(martensitic) but employing a diffusion of excessive carbon away from the newly
self-forming ferrite phase. Depending on the undercooling, the transformation
occurs during a limited time span, which limits an effective distance the
diffusion can affect. The resulting microstructure thus differs from dendritic structure
or needle-shaped bainite (for faster cooling) to a lamellar structure called
pearlite (slower cooling). The thickness of the lamellas is inversely
proportional to the undercooling [1].
Mechanical
properties
The mechanical
properties of the resulting pearlite can be roughly described as follows: The
yield stress of pearlite is inversely proportional to a certain power of its
interlamellar spacing S:
![]() . (1)
. (1)
The equation is referred to as
Hall-Petch relationship and originally describes an enhancement of the yield
stress with the refinement of the grains (mh = 1/2).
The extrapolation to an infinitely thick lamellas s0 yields negative values for mh = 1/2,
thus mh = 1 is usually considered. Alternatively an
expression based on the dislocation motion in within lamellas was derived [2],
where s ~ S–1ln(SVa/b), b
is the Burgers vector and Va a volume portion of ferrite in
pearlite. This expression is equivalent to (1) and mh = 1
for large S and deviates towards mh = 1/2
for thinner lamellas. The past studies of fully pearlitic eutectoid and
hypereutectoid (carbon content ≥ 0.73 wt.%) steels [3, 4] with
experimental values of S typically ranging from 150 to 250 nm did
not allow to determine properly the nature of the dependence.
The behaviour of the hypoeutectoid
(carbon content < 0.73 wt.%) steel is even more complex, as it is
a composite formed from primarily crystallized ferrite grains with a size at
the order of microns and the pearlitic colonies of similar size (several
microns). The combination of micro- and nano-scale originated effects
superimpose and the early investigations of yield stress [3] were not much
successful in description of the composite behaviour. Recently, self-consistent
simulation procedures were introduced [5], which allow modeling of the
stress-strain curves at higher stages of deformation at least.
Experimental
The samples
were hot-rolled under different temperatures in an industrial type of rolling
stage with one to 14 passes through the rolls. After the rolling, the resulting
circular or elliptical profile was cooled down either on the air, in the water,
in a molten lead bath or their combination (e.g. first rest on the air, then
lead bath). The aim was to produce a variety of microstructures with different
mechanical properties. Specimen of the resulting materials were cut (both
normally and laterally), embedded into a resin matrix, ground, polished and
etched. The resulting surface (originally inside the profile) was investigated
by means X-ray diffraction on a Bragg-Brentano goniometer and also metallographically
investigated in an optical microscopy and scanning electron microscopy (SEM).
SEM allowed to determine basic microstructural parameters (volume portion of
pearlite and mean pearlite interlamellar spacing) directly. The choice of
samples for detailed metallographic investigation was made upon the results
obtained from X-ray diffraction.
X-Ray diffraction results
The
diffraction revealed a presence of residual stress in the steel, which is
expressed as an anisotropic shift of the diffraction lines [6]. The reason
could be the partial coherence of certain crystallographic planes of ferrite
and cementite in the pearlite arising from the displacive nature of the
eutectoid transformation. Furher on, an anisotropic dislocation-originated
broadening was observed (Fig. 1). The magnitude and anisotropy of the
integral breadth was evaluated according to
![]() . (2)
. (2)
Here l is the
radiation wavelength, binst instrumental broadening, bsize broadening due to a finite coherent
domain size (negligible) and edisl a root-mean-square microstrain in á100ñ direction, the anisotropy the
microstrain is described by parameter q [7]. The resulting values of q×e2disl are plotted versus e2disl in Figure 2, the q parameter
corresponds well with the expected presence of edge dislocations with Burgers
vector b = a/2×á111ñ. The magnitude of squared
dislocation microstrain differs by almost one order for different pearlitic
samples, so differs also the density of the dislocations.
|
Figure 1. Typical Williamson-Hall plot of the ferrite diffraction lines broadening. Broken line corresponds to instrumental broadening, cranky line connects the fitted theoretical values. |
Figure 2. Squared dislocation microstrain
and its anisotropy observed in diffraction line broadening. |

Microscopy
Figure 3
shows a microscopic view on the ferrito-pearlitic steel in three different
magnifications. Optical microscopy (Fig. 3a) can be exploited to determine
the pearlite volume fraction, since primary ferrite is displayed as light
areas. SEM allows to gain a mean interlamellar spacing in pearlite by means of
statistical methods [8]. The transmission electron microscopy (TEM) was
utilised to reveal the details of microstructure. As obvious in Figure 3c,
there are deformation fields present on the ferrite-cementite interface in
pearlite. The origin of these can be found in the presence of misfit dislocations
accommodating the difference in lattice spacing of the originally continuous
lattice planes (before the transformation). The dislocations are almost equally
spaced in a particular pearlitic colony and their mutual distance ranges from
20 to 30 nanometres. The primary ferrite grains as well as the inner volume of
the ferritic lamellas in pearlite are practically free of any dislocation.
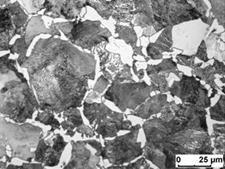
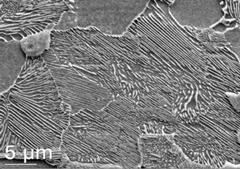
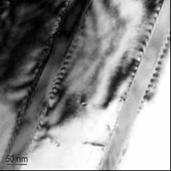
(a) (b) (c)
Figure 3. Optical microscopy (a) and scanning electron microscopy (b) image of ferrito-pearlitic steel and a detailed transmission electron microscopy (c) image of ferrite and cementite lamellas in the pearlite
Results
The assumption was made that the misfit dislocations are responsible for the X-ray diffraction line broadening. Another assumption was made that the density of the dislocations is proportional to the density of the lamellas. Together, the dislocation squared magnitude of the dislocation line broadening (or the squared dislocation originated microstrain) should be proportional to the density of the lamellas (Fig. 4). Ultimate tensile stress (UTS) is roughly proportional to the weighted average of the pearlite and ferrite strength. The strength of the pearlite is inversely proportional to its interlamellar spacing (1), thus even UTS should be proportional to the density of lamellas, more-over to the squared dislocation microstrain (Fig. 5).
|
Figure 4. Correlation of lamellar density and dislocation originated squared microstrain. |
Figure 5. Correlation of ultimate tensile
stress and dislocation originated squared microstrain. |
References
1. R. F. Mehl, W. C. Hagel, Progress in Metal Physics 6,
(1956), pp. 74134
2. L. M. Brown & R. K. Ham, in Strengthening
Methods in Crystals, edited by A. Kelly & R. B. Necholson, London,
1971, p. 12
3. K. K. Ray, D.
Mondal, Acta Metall. Mater. 39, (1991), pp. 22012208
4. A. M. Elwazri, P.
Wanjara,
5. S.
Allain, O. Bouaziz, Mat. Sci.
6. D. Šimek, D. Rafaja, M. Motylenko, V. Klemm, G. Schreiber, A. Brethfeld, G. Lehmann, Steel Research Int. 79, (2008), pp. 800806
7. T.
Ungár,
8. J. Ohser & U. Lorz, in Freiberger Forschungshefte B 276, Technischer Verlag für Grundstoffindustrie, Leipzig, Stuttgart, 1994, p. 104
Acknowledgements.
The
authors also wish to thank to the German Scientific Council (DFG) for
supporting the project # RA 1050/10 in frame of the priority
programme SPP 1204.