Zeolite membrane -
MFI
J. Drahokoupil1,2 , Pavel Hrabánek3, A. Zikánová3, M.Kočiřík3
1Institute of Physics of the
ASCR, v.v.i.; Na Slovance 2, 18221 Prague 8, Czech Republic
2FJFI CTU in
3J.Heyrovský
jandrahokoupil@seznam.cz
Keywords: X-ray, Texture, Zeolite
Introduction
The oriented zeolite MFI (ZSM-5 and silicalite-1) layers were already synthesized on different supports and showed their attractiveness for the applications in the fields of membranes [1], microreactors, sensors and optoelectronic devices. For MFI zeolite membranes, the most favorable configuration would be a thin, fully intergrown b-oriented layer that would exhibit higher fluxes in comparison with a, c or random oriented layers. It is also known that the orientation of crystals essentially determines the crack formation during template removal, where different expansion/shrinkage properties of MFI crystallographic axes are responsible. It has been suggested that the preparation of a, b-oriented layer is more advantageous due to the template removal [2].
Experimental
The direct hydrothermal in-situ syntheses of silicalite-1 layers were carried out on the surface of mercury, silicon wafer, non-porous and porous stainless steel TRUMEMTM supports. The crystallizations of MFI layers were performed in the temperature range of 155-165°C under static conditions with duration of crystallization between 1 to 20 hours.
The synthesized crystal layers were washed
in an ultrasonic bath, dried and further characterized with scanning electron
microscope (JEOL JSM 5500LV).
The X-ray diffraction pattern were measured on PANalytical X`Pert diffractometer in Brag-Brentano geometry. The Co radiation was used.
Structure
of MFI
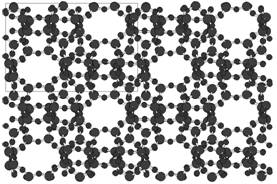
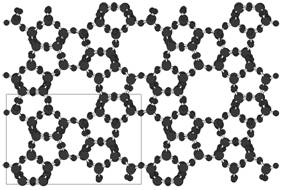
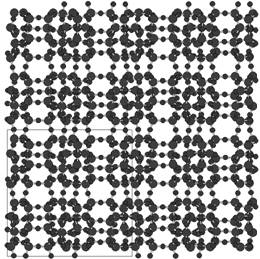
The FMI zeolites crystallite in Pnma space group. The lattice parameters of ZSM-5 are following: a = 20.048, b = 19.884, c = 13.352, α, β, γ = 90°, lattice parameters of Silicalite-1 are a little varied. The structure contains relatively big pores which run through the structure in (100) and (010) directions. The three basic orientations ((100), (010), (001)) are shown in Fig. 1.
|
a) |
b) |
c) |
|
Figure
1. The tree basic orientation of MFI framework,
a) (100) direction, b) (010) direction, c) (001) direction. The four unit
cells are plotted in
every figure. |
||
Diffraction
pattern
Besides the low angle region, the
diffraction peaks are mostly overlapped because of relatively big orthorhombic
unit cell. Some important higher angle diffractions can be observed without
undesirable overlapping in strongly textured samples. Fig. 2 shows a computed theoretical non-textured
diffraction pattern of silicalite-1 with comparison of strongly
textured one (sample 17-08 (floating)), where mainly the (100) and (010)
orientation are observed.
|
a) |
b) |
|
Figure 2. a) The theoretical non-textured diffraction pattern of silicalite-1. b) Strongly orientated silicalite-1 membrane (sample 17-08), a overlapping of (101,110) and Kβ (200,020) diffraction is shown. In both cases Co radiation was used. |
|
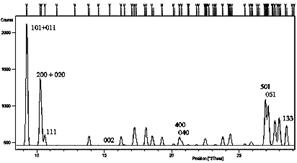
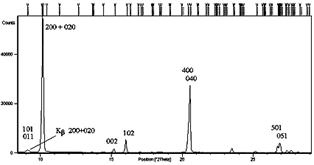
The
diffraction pattern 2b) shows also small (002) and (102) preferred orientation
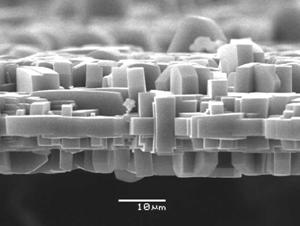
which corresponds to SEM observation in Fig 3.
|
|
|
|
Figure 3. SEM micrograph of thin layer of sample 17-08 (floating). |
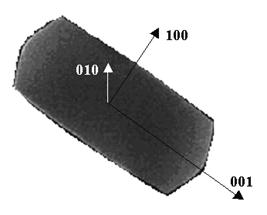
Figure 4. The relation between macroscopic grain shape and crystallographic directions. |
CPO indexes
The overlapping of diffraction peaks complicated the orientation dependent study of the film therefore CPO[X]/[Y] (crystallographic preferred orientation based on the [X] peak and the [Y] peak) was defined in the following way [3]:
![]()
Where [X] and [Y] are chosen crystalografic direction, IS is intensity of sample and IP is intensity of non-textured powder. If CPO index is equal to 1 then the sample has only [X] orientation, for CPO = 0 is the sample non-textured and for negative CPO index the sample prefer [Y] orientation.
Results and discusion
Several CPO indexes was calculated and compared. Two of them are in Tab. 1. The first one CPO [200+020]/[133] enable distinguish between (100+010) and “random” orientation. Due to resolution of x-ray diffractometer the (200) and (020) reflextion can not be measured separable and are consider as one line. The second one CPO index [0 10 0]/[10 0 10] distinguish between (100) and (010) orientation. Because of overlapping with several others diffraction the second one index can be used only when the first one is close to one, in this case the intensity of (0 10 0) and (10 0 0) diffraction are much more bigger than the other reflection diffracting to this area.
Table 1. CPO indexes for several samples.
|
sample |
CPO |
|
|
[200+020] / [133] |
[0 10 0] / [10 0 0] |
|
|
17-08 (floating) |
0.99 |
0.30 |
|
3z - 08 |
0.84 |
0.68 |
|
16-08 |
-18 |
0.70 |
Conclusions
The CPO indexes given by X-ray diffraction compared with SEM micrograph helps in understanding the grooving of MFI thin layers and their preferred orientation on the surface of studied supports.
References
1. S. Aguado, E.E. McLeary,
A. Nijmeijer, M. Luiten, J.C. Jansen, F. Kapteijn, Micropor. Mesopor. Mat. 120 (2009) 165-169.
3.
J.P.
Verduijn, A.J. Bons, M.H. Anthonis, L.H. Czarnetzki, Int. Patent Appl. PCT WO
96/01683.
Acknowledgements.
The financial support by the Czech Science Foundation
via grant
No. 203/07/1443 and the