Study of the phase composition of Fe2O3
nanoparticles
Václav Valeš1, Jana Poltierová-Vejpravová1, Petr
Brázda2,
1Department of Condensed
Matter Physics, Faculty of Mathematics and Physics,
2Department of Inorganic
Chemistry, Faculty of Science,
Introduction
Important physical properties
of nanoparticles are determined mainly by their atomic structure, especially by
their phase composition and the presence of structure defects. X-ray
diffraction is a good tool for studying the structure of the nanoparticles, its
application for very small particles is however limited by very small intensity
of the scattered wave. For this reason special experimental setups, like e.g.
diffraction with small incidence angle, are used and many experiments have to
be done at synchrotrons. Standard methods of the measured data analysis based
on the description of the diffraction using instrumental functions and
functions of physical broadening of the lines fail in the case of very small
particles. An ab-initio calculation method (based on the Debye formula [1, 2])
has to be used instead.
In this work the Debye formula
is used for the description of the diffraction of iron oxide samples measured
at ANKA synchrotron in
Measured samples
The great interest in Fe2O3
nanoparticles is caused mainly by magnetic properties of these particles,
namely extremely high room temperature coercivity of epsilon phase of these
iron oxide nanoparticles. The samples were prepared by ex-situ annealing of
organic precursors and then measured at ANKA synchrotron in
Theoretical
description
Debye formula in Eq. (1),
which has been used for the x-ray data analysis describes the intensity
distribution of the samples consisting of the same randomly oriented particles,
knowing the positions of the atoms in one such a particle.
![]()
(1)
where the double sum goes over
all atoms in the particle, Q is the
length of the scattering vector, fi
is the atom form factor of the i-th
atom and rij is the
distance between i-th and j-th atom. The formula is valid for any
arrangement of atoms in any particle; no lattice is needed; only exact
positions of atoms in the particle are important. The only technical limit of
using of this equation is the number of terms in the double sum. For instance,
a particle of Fe2O3 of diameter of 13 nm contains about
105 atoms, which means that there are 1010 interatomic
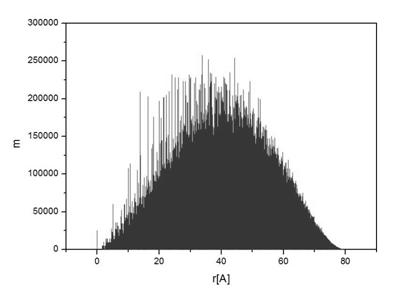
distances that have to be taken into account for every Q. For this reason, the distribution function of atomic pairs was
calculated and a histogram of all interatomic distances was created; an example
of such histogram is shown in Fig. 1 corresponding to a spherical particle with
the radius of 40 Å, the histogram has been constructed using the step
width of 0.01 Å.
|
|
|
|
Figure 1. Calculated
histogram of interatomic distances in a spherical Fe2O3
particle of radius of 40 Å. The histogram step is 0.01 Å. |
Figure 2. Calculation of
diffraction curves for different phases of Fe2O3. The
full line corresponds to the pure maghemite particle of radius of 50 Å; the dotted one to the pure ε-Fe2O3
particle of the same radius; and the dashed line represents the diffraction
from the particles of radius 50 Å, which consist of
the core (radius 40 Å) of maghemite and the shell of ε-Fe2O3. |

Since we introduced the histogram
of interatomic distances, we can rewrite the Eq. (1) using calculated data from
the histogram, i.e. we know the multiplicity of each of interval of distances.
The rewritten form of Debye formula in equation (2) enables us to perform
calculations for much larger samples. For the intensity we can write
![]()
(2)
where mi is the multiplicity factor for the i-th interval of distances. The
expression in Eq. (2) is valid only for one type of atoms in the particle,
which is not our case (because of different atom form factors). This fact
requires only some technical changes, which do not affect the fundamental
meaning of Eq. (2).
The phase transition from one
phase to the other is supposed to take place from the particle surface to its
center. For this reason the core-shell model of the particle (particle
consisting of two different phases) has been introduced to the Debye formula
program. In order to have a brief look in to the behavior of the simulated data
calculated by our model, diffraction curves for different phases were
calculated (Fig. 2). From this picture the difference between the maghemite and
ε phases of Fe2O3 can be seen as well as the effect
of the core-shell structure of these two phases, which causes some “mixture” of
the diffraction pattern of both phases.
Data analysis
Several samples from the
series described above were analysed by the Debye-formula approach using the
core-shell model, assuming that the interface of the two phases moves from the
surface to the center of the particle. The data from the Figs. 3 – 5 (samples A
– C) were fitted by hand and the results are summarized in Table 1; the errors
were estimated from this fit too. The background was approximated ad-hoc by a
polynomial of the third power. The broad peak around 13º is caused by the
amorphous SiO2 matrix and for our fitting is not important. The fits
describe the measured data well and the parameters of the core-shell model were
obtained. The sample D (Fig. 6) could not have been fitted because of a too
large size of the particles that made the simulation extremely time-consuming.
|
|
|
|
Figure 3. Sample A.
Measured data and fit of the sample annealed at the 900 ºC as the
highest temperature. |
Figure 4. Sample B.
Measured data and fit of the sample annealed at the 950 ºC as the
highest temperature. |

|
|
|
|
Figure 5. Sample C.
Measured data and fit of the sample annealed at the 1000 ºC as the
highest temperature. |
Figure 6. Sample D.
Measured data of the sample annealed at the 1100 ºC as the highest
temperature. |


Table
1.
Results obtained from the measured data fitting
|
Sample |
Total radius (Å) |
Maghemite (%) |
ε-Fe2O3 (%) |
|
A |
40 ± 4 |
34 ± 5 |
66 ± 5 |
|
B |
50 ± 5 |
26 ± 3 |
74 ± 3 |
|
C |
58 ± 5 |
0 ± 8 |
100 ± 8 |
From the fitting of the
measured data we obtained the total size of analyzed samples (A – C) and the
fraction of the maghemite and ε phase assuming the core-shell model with
maghemite as a core. It can be seen that the size of the particles increase
with increasing annealing temperature and that the fraction of maghemite
decreases and it completely vanishes at the temperature of 1000 ºC. This
corresponds to the assumption presented above. As for the sample D, which has
not been analysed, the hematite diffraction peaks appear.
Both he core-shell model of
the nanoparticles and the Debye formula are suitable tools for the analysis of
our samples. In the future we have to investigate, whether it is possible to
distinguish between the core and the shell, i.e., whether we can determine
which phase is in the core and which one is in the shell. A method, which would
enable us to analyze larger particles, has to be implemented as well.
References
1. A. Cervellino, C. Giannini, A. Guagliardi and D.
Zanchet, Eur. Phys. J. B 41 (2004), 485.
2. A. Cervellino, C. Giannini and A. Guagliardi, J. Appl. Cryst. 36 (2003), 1148.
3. Chang-Woo Lee, Sung-Soo Jung and Jai-Sung
Lee, Materials Letters 62 (2008), 561.
4. M. Gich, C. Frontera, A. Roig et al, Chemistry of Materials 18 (2006), 3889.
5. P. Brázda, D. Nižňanský,
J.-L. Rehspringer, J. Poltierová Vejpravová, J. Sol-Gel Sci. Technol., 51
(2009), 78-83.