XRD study of thickness dependence of crystallization and stresses of TiO2 thin films
L. Nichtová, R. Kužel, Z. Matěj
Department of Condensed Matter
Physics, Facuty of Mathematics and Physics, Charles University in Prague,
121 16 Praha 2, Czech Republic
nichtova@email.cz
Titanium dioxide is a material intensively investigated not only because of its good chemical stability, mechanical hardness, high refractive index and nontoxicity but also due to its photocatalytic activity enabling a conversion of solar light into useful chemical energy. It is known that photocatalytic activity of titanium dioxide strongly depends on crystallization and phase composition.
In this work a complex x-ray diffraction (XRD) study of thin TiO2
films on Si substrates with different thicknesses (50−2000 nm) prepared
by magnetron sputtering is presented. Crystallisation process of amorphous
films was studied in-situ. XRD reflectivity, texture and stress measurements
were performed ex‑situ. Other amorphous and nanocrystalline powders were also
measured for comparison.
In-situ xrd measurements were done with the aid of X’Pert Pro
diffractometer with MRI high-temperature chamber. Annealing temperatures were
selected below the temperature where fast crystallization appears (about 220
°C). The process is then slow and allows detailed time in-situ investigations
even in laboratory conditions. Strong dependence of crystallization kinetics on
the film thickness was found. In particular for the samples with thickness
lower than 300 nm. The process could be well described by the Avrami equation
[1] (modified by the introduction of initial time of crystallization). The
evolution of the integrated intensities I (Figure 1) of diffraction lines of anatase
phase is then described as, I = 1-exp[-b(t–t0)n)],
where the initial time of crystallization t0 is related to
the first appearance of any diffracted intensity above the background level at
the peak position. It increases abruptly with decreasing thickness. The rate of
crystallization b grows quickly with the thickness. Low values of n
(~ 2) indicate two-dimensional character of the crystallite growth. Changes of
preferred orientation and stress generation during the crystallization were
observed.
Figure 1. Normalized integrated intensity of anatase diffraction peak 101 in dependence on annealing time (annealing temperature 180 °C) for films of different thickness (symbols … experimental values, lines … fitted Avrami equations)
Tensile residual stresses were developed slowly during the
crystallization and confirmed later by detailed measurements at room
temperature. In the first step, the stress measurements were analysed with X'Pert
Stress program by means of the dhkl vs. sin 2y plots. Slopes and intercepts of the sin
2y plots
were obtained. In the second step, the stress values were determined from the
analysis of all the reflections assuming symmetrical bi-axial state of the
residual stress and the weighted Reuss- Voigt grain interaction model [2]. Figure
2 shows obtained and calculated slopes divided
by the corresponding intercepts of the sin
2y plots for all measured reflections for the sample with thickness 440 nm
annealed at 200 °C. Systematic anisotropy, observed for all investigated
samples, can be well described by the weighted Reuss-Voigt model using single
crystal elastic constants of anatase [3] which recently appeared. The
anisotropy is completely different for rutile – the second phase of tetragonal TiO2.
Figure 3 shows relative deviation of obtained and calculated sin 2y intercepts. Deviations are
rather small, comparable with the rounding error of the intercepts values in
the X'Pert Stress program. Rapidly increasing value of residual stress with
decreasing film thickness was observed (Figure 4).
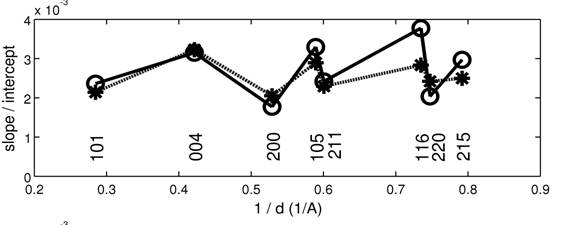
Figure 2. Comparison of slopes divided by corresponding intercepts of the sin 2y plots for the 440 nm thin film sample (o) and simulated XECs anisotropy dependence (*).
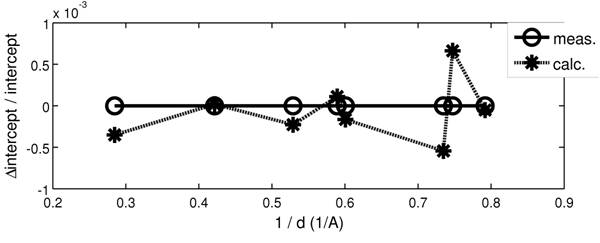
Figure 3. Relative differences of intercepts of sin 2y plots for the 440 nm thin film sample (o) and simulated data (*).
Figure 4. Film thickness dependence of the residual stress.
[1] M. J. Avrami, J. Chem. Phys. 7 1103 (1939)
[2] M. Dopita, D. Rafaja, Z. Kristallogr. Suppl. 23 (2006) 67-72
[3] M. Iuga, G. Steinle-Neumann, J.
Meinhardt, Eur. Phys. J. B 58
(2007) 127-133