Mapping of crystal lattice misorientation by rocking curve imaging
P. Mikulík1, D. Lübbert2, L. Helfen3, P. Pernot3, T. Baumbach2
1Department of Condensed Matter Physics, Masaryk University, Brno, Czech Republic
2ISS and ANKA, Karlsruhe, Germany
3ESRF, Grenoble, France
mikulik@physics.muni.cz
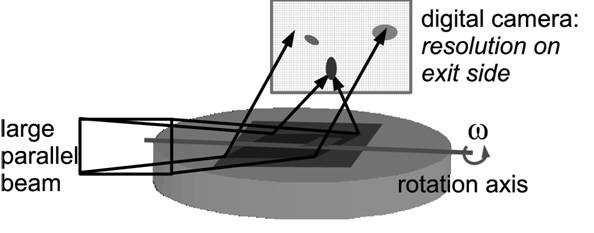
Synchrotron radiation diffraction rocking curve imaging (RCI) is a technique which combines full-field X-ray digital topography and Bragg-diffraction rocking curve recording [1,2,3]. Large parallel monochromatic beam irradiates a crystalline sample (e.g. a wafer) with a (sub)surface crystal lattice misorientation distribution characterized by local tilt angles. Series of digital topographs during sample rocking-curve rotation are recorded by a two-dimensional detector. The aim of the method is to back-project the data in order to reconstruct local lattice tilt distribution with high spatial and angular resolution on an extended sample surface area.
Local lattice tilts on the sample surface can be caused by local lattice misorientations (lattice waviness, misoriented crystallites, etc.) or due to deformation (strained grains, grain boundaries, etc.). There are two classical X-ray diffractometry methods which assess these properties: X-ray diffraction rocking curve measurement and X-ray diffraction topography. In the former method, a small monochromatic incident beam impinges on the sample surface and intensity of the diffracted beam is measured by an open scintillation detector during sample rotation. Sample has to be scanned to measure many local rocking curves; the achievable spatial resolution is given by slit sizes on the incident side and goes down to 0.1 mm. The latter method records diffraction image from an extended incident beam on high-resolution X-ray film which determines the spatial resolution on the exit side; there are many topography techniques to visualize different types of defects [4]. Recently, high-resolution two-dimensional digital detectors became available at synchrotron beamlines. Therefore it became possible to combine both methods and thus record digital topographs during sample rotation, see figure 1.
|
|
|
Figure 1. Schematic drawing of rocking curve imaging principle. |
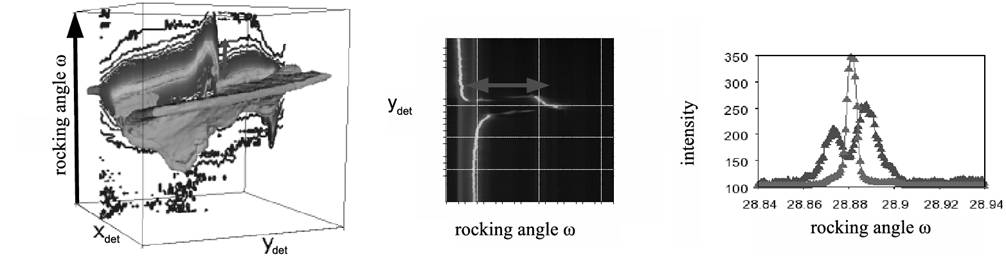
Consequently, series of digital topographs are measured by a two-dimensional detector (camera) at different sample orientations: rocking angle ω and sample azimuth. Simultaneous high spatial resolution (ones up to tens of micrometers) provided by the 2D detector and angular resolution (around 0.001°) allows to quantify crystalline structure perfectness over large sample area which scales with the area of the detector. Each series being an intensity volume x-y-ω from which peak characteristics of millions of local Bragg peaks from each series are extracted, figure 2. Each Bragg peak corresponds to diffraction from a surface point those local lattice tilt caused deflection of direction of the diffracted beam. Therefore each diffraction image is an overlap of spots those location on the sample surface is evident only for very short sample-detector distances. Otherwise, the inherent focusing-defocusing pattern of diffracted rays due to finite sample-detector distance and larger tilt values requires a reconstruction method in order to back-project the measured tilt components from the detector plane on the sample surface.
|
|
|
Figure 2. Rocking image series visualization as a full intensity volume, map (section) or individual rocking curves. |
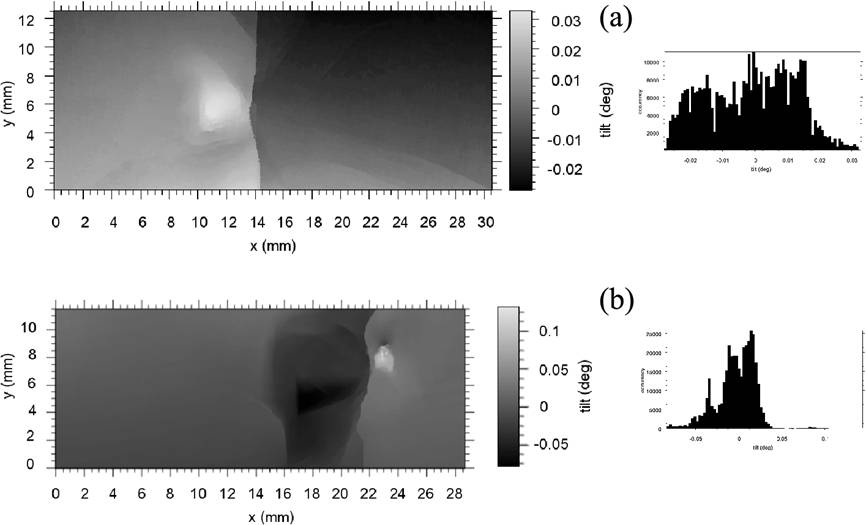
There are several reconstruction algorithms those complexity depends on deflection values and on type of defects (such as slowly-varying misorientated wafer regions or misoriented crystallites) [5,6]. Figure 3 shows back-projected tilt maps for two GaAs wafers with different range of misorientations values, in particular 0.033° and 0.22° for wafers (a) and (b), respectively.
|
|
|
Figure 3. Maps of tilts and the corresponding histograms for two GaAs wafers. |
References
1. D. Lübbert, T. Baumbach, J. Härtwig, E. Boller, & E. Pernot, Nucl. Inst. Meth. Phys. Res. B, 160, (2000), 521.
2. P. Mikulík, D. Lübbert, D. Korytár, P. Pernot, & T. Baumbach, J. Phys. D: Appl. Phys., 36, (2003), A74.
3. P. Mikulík, D. Lübbert, P. Pernot, L. Helfen, & T. Baumbach, Appl. Surf. Sci., 253, (2006), 188.
4. D.K. Bowen & B.K. Tanner, High Resolution X-Ray Diffractometry and Topography. London: Taylor & Francis. 1998.
5. I. Huber, P. Mikulík & T. Baumbach, phys. stat. sol., (2009), in print.
6. P. Mikulík, Absorption and diffraction imaging by synchrotron laminography, diffractometry and crystal optics. Habilitation. Brno: Masaryk University. 2008.
Acknowledgements.
This work was supported by project MSM0021622410 of the Ministry of Education of the Czech Republic.