Microstructural studies of materials prepared by severe plastic deformation
V.
Cherkaska1,
R. Ku�el1, Z. Mat�j1, M. Jane�ek2, �J. ��ek3, <orf id="">M. Dopita1,4
1Department of Condensed Matter Physics, 2Department of Physics of Materials, 3Department of Low Temperature Physics,
Faculty of Mathematics and Physics, Charles University in Prague, Ke Karlovu 5, 121 16 Praha 2, Czech Republic
4TU
Bergakademie Freiberg, Institute of Materials Science, Gustav Zeuner Str 5,
D-09599 Freiberg, Germany
Severe plastic deformation (SPD) is an effective tool for production of compact sub-microcrystalline (SMC), materials of high purity and no residual porosity. In principle, there are two basic techniques � equal channel angular pressing (ECAP) and high-pressure torsion (HPT) [e.g. 1]. In present work, samples prepared by both techniques were studied. Selected samples were pure copper and copper with additions of different amounts of Al2O3 and Zr, respectively. The composites are prepared in order to stabilize the fine microstructure to higher temperatures since recrystallization temperature of pure copper is rather low.
The samples were studied by X-ray powder
diffraction (PXRD), transmission electron microscopy (TEM), positron life-time
spectroscopy and electron back-scattered diffraction (EBSD). Conventional
powder diffraction was performed mainly with the aid of Seifert-FPM
diffractometer XRD7 and also with Panalytical system X�Pert Pro by using
variable divergence slits for keeping the irradiated area fixed and enhancement
of high-angle diffraction peaks. The evaluation consisted mainly in the line
profile analysis for the estimation of dislocation density and crystallite
size. In addition, complete texture measurement was done with Panalytical MRD
diffractometer equipped with the Eulerian cradle and polycapillary in the
primary beam.
Line broadening analysis showed that the HPT samples (6 GPa, 7 rotations) have smaller crystallite size compare to the ECAP samples, the dislocation densities are similar � of the order of 1�1015 m-2. There are only small changes in the mean dislocation density with the increasing number of passes for ECAP (Fig. 1). This fact is well confirmed also by positron annihilation.� However, the changes are visible in TEM pictures. After the first pass, the dislocation cells strongly elongated along {111} planes can be seen. Their average size is about 350 nm. Grain boundaries are mainly low-angle. After the second pass the microstructure is not much changed but the grain size is slightly reduced. After the fourth pass, the fraction of equiaxed subgrains increased and the larger proportion of high angle grain boundaries was observed. Equiaxed grain structure was found in about 50 % of the observed area. This is and indication that many new slip systems which are not parallel to the original slip system became active. After eight passes almost homogeneous microstructure with equiaxed subgrains separated by mostly high-angle grain boundaries was observed.
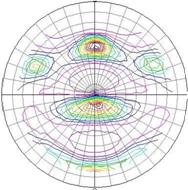
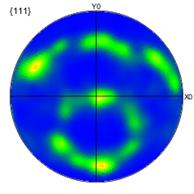
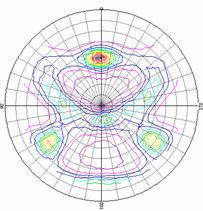
Pole figures obtained from HPT and ECAP are clearly different. The HPT samples usually don�t have very strong textures. They are always of fiber type. In several samples two components - (111) and (100) were found. ECAP samples have quite complicated textures that are changing with number and type of passes. The measurements were performed in the plane transversal to the direction of pressing. For one pass, they are in very good agreement with the measurements and simulation in [2]. The dominant component is (111) slightly inclined to the surface. With increasing number of passes more components appear and they are broader. After 8 passes, the (110) component is the strongest one. It seems that in samples with zirconium the texture components are a little sharper.
The above findings were more or less confirmed by the EBSD analysis (Fig. 2). There is a good agreement between pole figures obtained by EBSD and XRD (Fig. 3). The analysis of the deformed and recrystallized parts indicate changes from deformed part after one pass to about 70% recrystallized fraction after four and eight passes. These changes are not well visible in XRD profiles since the crystallite size in the range above 200 nm is already on the limit of sensitivity of the conventional powder diffraction. However, measurements in high-resolution setup and subsequent careful line profile analysis is worthwhile and under way.
Figure 1.� WH plots for the measured transversal direction of Cu samples, prepared with different number of ECAP passes: �, ™ � 1 pass; ¢, £ � 2 passes; ¿, ¯ � 4 passes; p, r � 8 passes showing good agreement of experimental (full symbols) and calculated (empty symbols) data. The calculated data are obtained by assuming common �dislocation model for f.c.c. structures.
Figure 2. EBSD maps of inverse pole figures of Cu processed with 1
(a); 2 (b); 4 (c); 8 (d) ECAP passes.
|
a |
d |
|
b |
e |
 (100)
(100)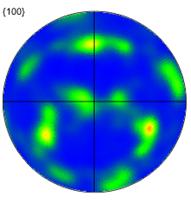
Figure 3. Comparison of pole figures
obtained by XRD (left column) and EBSD (right column) for Cu processed with 1
ECAP pass.
[1]�� R. Z. Valiev, I. V. Alexandrov, R. K. Islamgaliev. Processing and properties of nanostructured materials prepared by severe plastic deformation. Nanostruct. Mater.: Sci. Technol. ed. Chow G.M., Noskova N.I. � NATO ASI: Kluwer Publication. � 1998. � P. 121-143.
[2]� S. Lia, I. J. Beyerleinb, M.A.M. Bourke, Mat. Sci. Eng. A394 (2005) 66-77.
The work is a part of the
research program MSM 0021620834.