Preparation
and structure of TiO2 nanotubes
E. Pavlová1, M. Lapčíková1, M. Šlouf1,2, R. Kužel3
1Institute of Macromolecular
Chemistry, Academy of Sciences of the Czech Republic, Heyrovskeho nam. 2, 162
06 Praha 6, Czech Republic
2Member of Consortium for Research of
Nanostructured and Crosslinked Polymeric Materials (CRNCPM)
3Department of Electronic Structures,
Faculty of Mathematics and Physics, Charles University,
121 16
Praha 2, Ke Karlovu 5, Czech Republic
Titanium oxide
nanotubes were synthetized and characterized by means of high-resolution scanning
electron microscopy (SEM, STEM, EDS) and powder X-ray diffraction (PXRD). The
prepared TiO2 nanotubes represent quite new morphology of TiO2
(cf. Figs. 1 and 2). Their crystalline structure is different from all common
modifications of TiO2, i.e. rutile, anatase and brookite (Fig. 3).
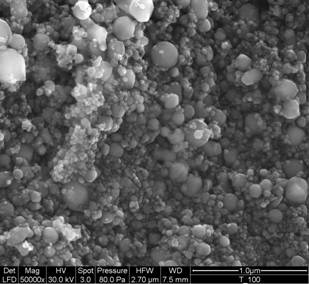
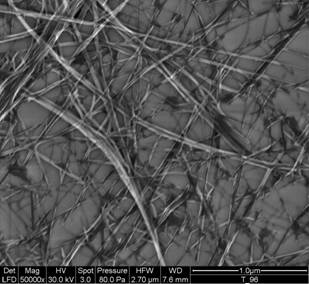
Synthesis of the TiO2 nanotubes was based on the procedures described elsewhere [[1], [2]]. Titanium oxide powder (from Aldrich; Fig. 1) in 10 M aqueous NaOH solution was placed in a 250 ml teflon flask, which, in turn, was placed for 24 h in an oil bath at 120 °C. The mixture was washed with distilled water till the pH of solution was approx. 8. The product was left in the form of water suspension, where it is stable for at least several months. We managed to sytnthetize TiO2 nanotubes not only from pure anatase as stated in ref. [[3]], but also from the mixture of modifications, anatase and rutile using TiO2 nanopowder or TiO2 technical powder (both supplied by Aldrich). The first series of the specimens (denotes as: specimens from solution) for SEM and PXRD was prepared as follows: the TiO2 nanotubes in water suspension were dispersed by means of ultrasonication and then a small drop was put to the microscopic support glass and left to evaporate (Fig. 2). The second series of the specimens (specimens from powder) was prepared by filtration of the TiO2 nanotubes and the filtrate was dried completely at room temperature. However, SEM observations showed that the second preparation procedure leads to partial merging of the single TiO2 nanotubes into agglomerates.
|
|
|
|
Figure 1. SEM micrograph of the original TiO2 nanopowder. |
Figure 2. SEM micrograph of TiO2 nanotubes; the first preparation
procedure. |
Powder patterns of TiO2 technical powder (P01), TiO2 nanopowder (P02), TiO2 nanotubes from the first preparation procedure (G01) and TiO2 nanotubes from the second procedure described above (P03) are shown in Fig. 3. Samples P01, P02 and P03 (dried powders) were measured in both Bragg-Brentano geometry and parallel beam technique with the angles of incidence of 1 - 3 º by using of XRD-FPM and X’Pert MRD Pro diffractometers. Sample G01 (thin layer of TiO2 nanotubes on support glass) was measured only by the latter method. The results obtained by the parallel beam technique only are shown on Fig. 3. Technical powder consists of pure anatase phase while the nanopowder was a mixture of anatase and rutile. Three quite narrow peaks obtained from sample G01 does not correspond strictly to any of the known TiO2 phases. Nanotubes from powder (P03) also give rather different diffraction pattern (Fig. 4d). Similar pattern was found by the authors of [2]. They reported trititanate H2Ti3O7 nanotubes. In our case the correspondence to this phase is not so good. Better agreement could be found for another phase - hydrogen titanium oxide hydrate H2Ti2O5.H2O. The correspondence of intensities is not very good but specific features of the diffraction by nanotubes have not been incorporated into calculation yet. The comparison on Fig. 4 is only performed with the PDF patterns [4].
|
|
|
|
(a) Sample P01: commercial
technical powder; pure anatase. |
(b) Sample P02:
commercial nanopowder; mixture of anatase
and rutile. |
|
|
|
|
(c) Sample G01: nanotubes
from solution. The broad peak
corresponds to the glass substrate, three narrow peaks from the sample
unidentified. |
(d) Sample P03:
nanotubes from powder; the diffraction pattern is similar to H2Ti2O5.H2O,
differing from rutile, anatase and brookite. |

Figure 3. Powder diffraction patterns of TiO2 obtained by parallel beam technique and detector scan (angles of incidence – 2 º). Bars and narrow peaks indicate theoretical peak positions of rutile and anatase (a-c) and hydrogen titanium oxide hydrate (d).
Acknowledgements:
MŠ is indebted for financial support trough grant 203/04/0688 awarded by the
Grant Agency of the Czech Republic and for the participation in the EU Network of
Excellence „Nanostructured Multifunctional Polymer Based Materials and
Nanocomposites“(NANOFUN-POLY). RK acknowledges the support through research program
MSM 0021620834 financed by the Ministry of Education of the Czech Republic.
References