MDFT PROGRAM: CALCULATION OF 2D AND 1D DIFFRACTION PATTERNS FROM ELECTRON MICROGRAPHS
M. Šlouf, H. Synková, J. Baldrian
Institute of Macromolecular Chemistry,
Academy of Sciences of the Czech Republic, Heyrovského náměstí 2, 16206 Praha, Czech
Republic;
Introduction
Ultrahigh molecular weight polyethylene (UHMWPE) is used in arthroplasty as a part of total joint replacements (TJR). Numerous studies show that the life-limiting factor for TJRs is the wear of UHMWPE [1]. To increase wear resistance, UHMWPE is crosslinked by ionizing radiation, such as gamma rays or accelerated electrons. After crossliniking the material is thermally treated to remove macroradicals, which may cause long-term oxidative degradation [2]. Both crosslinking and thermal treatment influence molecular and supermolecular structure of UHMWPE. The supermolecular structure affects other important properties of the material, such as stiffness, toughness, creep and fatique behavior [3]. The changes of supermolecular structure can be followed routinely by means of small- and wide-angle X-ray scattering (SAXS and WAXS) [4].
To get insight in the structural changes, we monitored the UHMWPE after irradiation and thermal treatment also with microscopic, spectroscopic and thermal techniques. In this study we focus our attention on scanning electron microscopy (SEM). SEM micrographs show the UHMWPE structure directly, but the information we obtain is only qualitative. To obtain some (semi)quantitative information, image analysis is needed. In the following text we present a simple program, called MDFT, which can calculate two-dimensional (2D) and one-dimensional (1D) discrete Fourier transform (FT) of SEM microphotographs. We show that this program yields semiquantitative information analogous to what we obtain from SAXS curves.
Experimental
part
Material. UHMWPE (Chirulen 1020, PolyHiSolidur) prepared by compression molding, was used in all experiments. Samples (50 x 50 x 1 mm) were cut from the rods, which were intensively cooled to avoid structural changes due to elevated temperature.
Irradiation. The samples were irradiated with accelerated electrons, in air, at room temperature, with doses from 0 to 200 kGy and extremely high dose rates > 50 kGy/min. In general the irradiation in air causes oxidative degradation leading to chain scissions [5]. However, crosslinking predominates over chain scissions if very high dose rates are used, as evidenced by both our investigations [6] and literature [7].
Thermal treatment. The samples were put to a press heated at 200 oC for 10 min. The whole experiment was performed at low oxygen atmosphere.
Small
angle X-ray scattering (SAXS) curves were measured
using Kratky camera (A. Paar,
Scanning electron microscopy (SEM). The samples were cut on rotary microtome RM 2155 (Leica) and the resulting smooth surfaces were etched with permanganic mixture as described elsewhere [8]. The etched surfaces were fixed to copper supports and covered with a thin platinum layer using vacuum sputter coater (Balzers) to avoid charging, improve resolution and decrease sample damage in electron microscope. Finally the samples were observed in SEM microscope (Tescan) using secondary electrons at 30 kV. The crystalline regions manifest themselves as bright lines in the resulting SEM micrograps because they are etched more slowly than the amorphous regions.
Description
of MDFT program
Briefly speaking, MDFT program reads a grayscale image, calculates its Fourier transform and outputs the result in the form of 2D grayscale image or 1D graph. In more detailed view the program is a package of six independent subroutines: the first reads the input, the second calculates 2D FT, the third performs scaling and various modifications of the calculated values, the fourth outputs 2D-FT as an image, the fifth converts 2D-FT data into 1D-FT data and the sixth outputs 1D-FT as a graph. Each of the subroutines offers some options, which provide the user with the control over the calculation and make program flexible. Key features of the program are described in Appendix A, full description of the options can be found in the help file attached to the MDFT package [9]. MDFT relies on free software tools: Perl [10] is the programming language, GD library [11] with the corresponding Perl module GD.pm [12] manipulates the images and Gnuplot [13] plots the graphs. Unfortunately, the current version uses only slightly optimized FT algorithm and, as a result, the program is rather slow. The calculation can take several minutes with large images. Fast Fourier transform will be added in the next version.
From the point of view of diffraction itself, both SAXS and WAXS are based on the same formula, relating amplitude of scattered radiation, A(S), and electron density in the studied material, r(r):
![]() , (1)
, (1)
where the integration runs through the whole space and S is scattering vector [15]. The above formula is, in fact, 3D FT of the object in real/direct space into the diffraction pattern in reciprocal space. Using this formula we can calculate diffraction pattern of any 3D (and also 2D or 1D) object. That is why we can also calculate the diffraction pattern corresponding to a SEM microphotograph using 2D-Fourier transform (ref. [16,17], Fig. 1), by means of:
![]() , (2)
, (2)
where (x,y) are coordinates of the pixel in the input image, (k,l) are coordinates of the pixel in the output image, f(x,y) and F(k,l) represent the grayscale intensity of the pixel in input and output image, respectively, N is the dimension of the (square) input image and the double summation runs through the whole picture. The resulting 2D diffraction pattern can be converted to 1D diffraction pattern by simple numerical averaging (ref. [9]; Fig. 2), from which the long period (LP) can be obtained by means of a formula derived from Bragg’s law. In this particular case the LP was calculated by:
![]() , (3)
, (3)
where SMAX is the position of the first local maximum on the calculated 1D diffraction pattern and RWI is the real width of the analyzed SEM micrograph.
Results
MDFT program was applied to four SEM microphotographs, which represent non-irradiated, non-remelted sample (denoted as 0 kGy, Fig. 1a), non-irradiated, remelted sample (0 kGy RM, Fig. 1b), irradiated, non-remelted sample (100 kGy, Fig. 1c) and irradiated, remelted sample (100 kGy RM, Fig. 1d). The changes of supermolecular structure are observable directly. From the qualitative point of view, the SEM micrographs suggest that remelting results in much finer supermolecular structure, whereas irradiation slightly increases structure coarseness. This is in agreement with our previous studies [4,14].
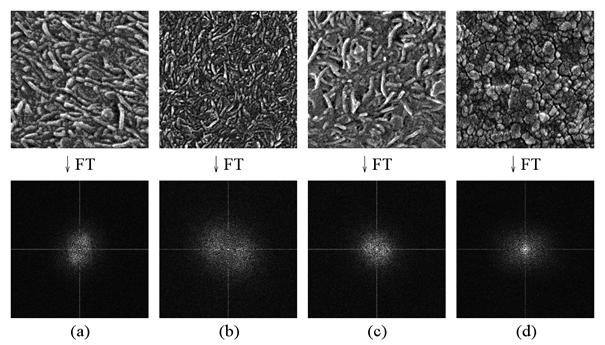
Fig. 1. UHMWPE samples and their 2D-FT transforms calculated with program MDFT:
(a) 0 kGy, (b) 0 kGy RM, (c) 100 kGy and (d) 100 kGy RM sample. Real width of all SEM micrographs is 2.4 mm.
However, qualitative information must be extracted from the micrographs by some measurement or, in other words, by image analysis. The question is what to measure. Standard image analysis would require separation of amorphous and crystalline regions in the image, followed by determination of their average size. At first sight, this would be a tedious job. MDFT program represents quite different approach and offers an elegant solution of the problem. In the first step, MDFT reads the micrographs and calculates their 2D-FT patterns using equation 2 (Fig. 1, bottom row). In the second step, MDFT converts 2D-FT patterns to 1D-FT patterns (Fig. 2). The user just finds the first local maximum on 1D-FT curve and calculates the LP (i.e. average repeating distance between crystalline and amorphous regions on the micrographs) by means of equation 3.
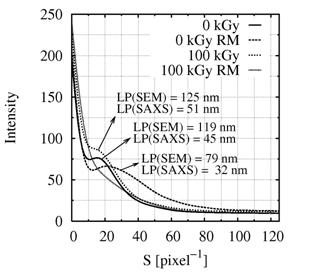
Fig. 2. 1D-FT transform of UHMWPE samples.
Although the changes of LP obtained from SEM (LPSEM) and LP from SAXS (LPSAXS) are similar as documented in Fig. 2, the absolute values of LPSEM and LPSAXS differ from each other, which results from intrinsic differences between SEM and SAXS. Firstly, the thinnest lamellae are below the SEM resolution, which makes the values from SEM systematically higher. Secondly, in SAXS we investigate quite a large part of the sample while in SEM we see just a small region. Thirdly, the position of the first peak on 1D-FT curve must be estimated by user, which may not be absolutely precise. And, finally, SAXS determines the LP from 3D sample, while in SEM we investigate just 2D section of the sample.
Conclusion
MDFT program calculates two- and one-dimensional Fourier transforms of grayscale images. In this study, MDFT was applied to SEM microphotographs of UHMWPE. 1D-FT patterns of the SEM micrographs yielded the average repeating distance between amorphous and crystalline regions, LPSEM. It was shown that this value qualitatively corresponds to the long period from SAXS, LPSAXS. Hence, the results are reasonable and MDFT program can be employed in analysis of any images displaying periodic structures.
Appendix A: MDFT and Other Analogous Programs
A few freeware programs or routines performing 2D-FT or 2D-DFT calculations can be found on the internet. These programs usually convert an array of numbers to its Fourier transform, using fast algorithms, not containing the procedures for manipulation with images and/or converting 2D and 1D Fourier transform patterns. Also several commercial software packages focused on image analysis include Fourier transform routines. They usually include user-friendly interface and run very fast, but they are a kind of blackbox: the possibilities of influencing the calculation are rather limited, if any.
MDFT program is different, being programmed in Perl [10] and controlled by means of the command-line scripts. It is neither user-friendly nor fast. However, it has several features, which are partially or completely missing in the analogous software mentioned above: (i) MDFT reads both image files and number arrays; (ii) MDFT can plot not only intensities, but also phases, real and imaginary components; (iii) MDFT puts central the spot in the centre of the Fourier transformed image; (iv) MDFT is able to insert a virtual beamstopper to the virtual diffraction experiment, i.e. it enables to eliminate or attenuate the central spot in the Fourier transform; (v) MDFT can do logarithmic transform of the resulting image; (vi) MDFT outputs 2D Fourier transforms as images or number arrays and (vii) MDFT converts 2D diffraction patterns to 1D diffraction patterns in the form of graphs of number arrays.
To conclude, MDFT is nothing more than yet another program calculating 2D-FT but it offers a few extra routines which are usually missing in the analogous software and provides the user with full control of the calculation. In particular, points (iv) and (v), listed above, are of great practical value because the intensity of the central spot is quite often too dominating. More details can be found in the brief help file that is a part of the program [9].
Appendix B: MDFT as a Learning Tool
Indispensable part of development of any program, even if it is not much complex, is its testing. MDFT program is trivial from the point of view of the algorithm but, at the same time it performs a huge amount of calculations. The main part of MDFT, calculating the discrete Fourier transform, is based on four nested for-cycles. That is why it was impossible to verify the correctness of the calculated values with a pocket calculator. Instead, the program had to be checked using some known simple examples (Fig. 3).
During testing the author of the program realized that the program can be used as a simple tool for learning and better understanding of Fourier transform in crystallography. The results in the form of grayscale pictures are understood intuitively. For example, the program can demonstrate the Bragg Law and the reciprocity principle (Fig. 3a,b) effect of orientation on the diffraction pattern (Fig. 3c,d), symmetry relationships in direct and reciprocal space (Fig. 3e,f) or effect of thermal motion on intensity at higher diffraction angles (Fig. 3g,h).
Two facts may be worth mentioning in the end: (i) more complicated effects, such as extinction and influence of crystal lattice imperfections on the diffraction pattern, can be demonstrated with MDFT as well (ii) and all the input images for testing shown in Fig. 3 were prepared quite easily using short scripts based on a combination of freeware programs ImageMagick [18], PerlMagick [19], Perl [10] and GD [11]; sample scripts are part of the MDFT help [9].
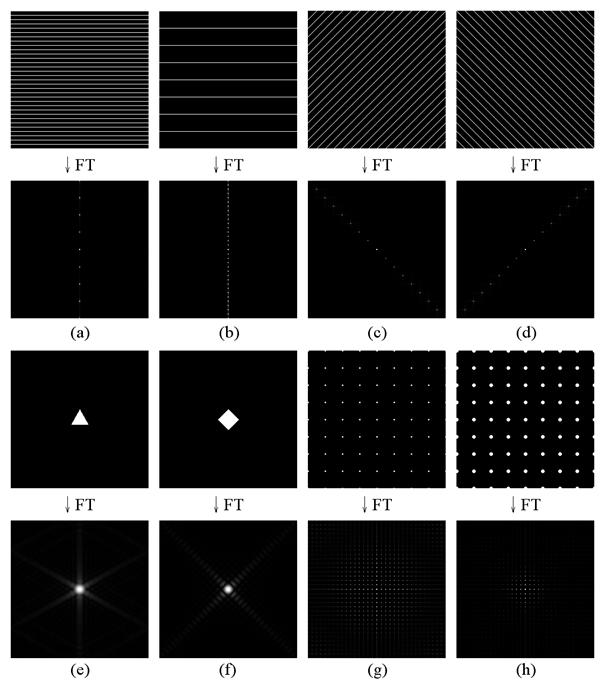
Fig. 3. Model images and their 2D-FT patterns calculated with MDFT.
Acknowledgement.
This work was supported by the
References
1.
A. Bellare, A. Bistolfi, K.
Simis & L. Pruitt, Proceedings of UHMWPE
for arthroplasty.
2.
F. Shen, H. & McKellop,
Proceedings of UHMWPE for arthroplasty.
3. G. Lewis, Biomaterials 22 (2001), 371-401.
4. M. Nevoralova, J. Mikesova, J. Baldrian & Z. Horak, Polym. Advan. Technol. 14 (2003) 802-806.
5. Kurtz S M, Muratoglu O K, Evans M & Edidin A A, Biomaterials 20 (1999) 1659-1688.
6. M. Šlouf, H. Synková, J. Baldrian, J. Kovářová, A. Marek, H. Dorschner & M. Stephan: Structural changes in irradiated UHMWPE. In preparation.
7. V. Premnath, A. Bellare, E. W. Merrill, M. Jasty & W. H. Harris, Polymer 40 (1999) 2215–2229.
8. N. D. Jordan, D. C. Bassett, R. H. Olley & N. G. Smith, J. Biomed. Mater. Res. 55 (2001) 158-163.
9. http://www.volny.cz/mirek.slouf/PROG/MDFT/mdft.htm
10. http://www.perl.com
11. http://www.boutell.com/gd
12. http://stein.cshl.org/WWW/software/GD
13. http://www.gnuplot.info
14.
H. Synkova, M. Slouf, J.
Baldrian, A. Sikora, J. Kovarova, M. Stephan: Proceedings of: World Polymer Congress Macro 2004,
15.
R. Ryong-Joon: Methods of X-ray
and Neutron Scattering.
16.
A. R. Clarke & C. N.
Eberhardt: Microscopy Techniques for Materials Science.
17. http://homepages.inf.ed.ac.uk/rbf/HIPR2/fourier.htm
18. http://www.imagemagick.org/
19. http://www.imagemagick.org/script/perl-magick.php