Qualitative phase analysis
Petr
Ondruš,
Czech geological Survey, Prague
Channel Linear Search/Match Algorithm
A brief description of the
algorithm is as follows.
1.
The
powder pattern angular range corresponding to 0 - 98° 2q Cu Ka is divided into ![]() channels (bit arrays). If a
pattern is acquired with a different wavelength, it is recalculated to that of
copper radiation. Patterns collected in an angular range exceeding the
indicated limit are truncated; the whole pattern is used if it was taken within
range.
channels (bit arrays). If a
pattern is acquired with a different wavelength, it is recalculated to that of
copper radiation. Patterns collected in an angular range exceeding the
indicated limit are truncated; the whole pattern is used if it was taken within
range.
2.
Reflection
positions in the pattern (found by the peak finding procedure) are calculated
into channel numbers (Ch) according
to Ch = 333 × Position (in 2Q units).
3.
The
sequential number for a particular reflection is placed into the appropriate
channel and spread over adjacent channels fulfilling the pre-selected tolerance
limit (Tol) resulting in ![]() .
.
4.
If
tolerance limits overlap, sequence numbers are assigned according to a special
procedure.
5.
The
ZDS PDF2 standards search/match index file is also channeled and is
complementary to the channeled powder pattern of the tested phase. Each record
of this index file represents one PDF2 standard and contains the 10 most
intense reflections sorted in descending order of intensity. Each array element
contains the channel number mentioned above.
6.
For
each card, the algorithm invokes progressively the i-th array element (for i
= 1, 2 , ..., Ns, where Ns ![]() 10). This refers to the channel number. The index of the
corresponding sample peak is obtained by looking up the content of the pattern
channel corresponding to this number.
10). This refers to the channel number. The index of the
corresponding sample peak is obtained by looking up the content of the pattern
channel corresponding to this number.
7.
After
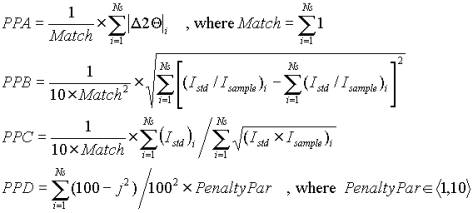
this procedure, four quasi-empirical parameters for all i-th standard reflections found in the tested pattern are
calculated in order to build up a score representing the fit between the card
and the sample. These are:
PPA reflects differences in reflection positions between the standard
and the sample.
PPB considers mutual intensity ratios of corresponding standard and
sample peaks.
PPC reflects an agreement in intensity values for reflections of the
sample and the standard
PPD considers whether the j-th
standard reflection in a sample powder pattern is missing
The probability that the sample
contains the standard then depends inversely on the parameter
Score = PPA+PPB+PPC+PPD.
Auto-calibration
of the standard is a very important part of the Search/Match procedure. During
auto-calibration, all standard reflection positions are shifted to bring the
most intense peaks of standard and sample to coincidence (if the position of
the standard peak falls within the tolerance limit). After that, the criterion
parameters mentioned above are calculated. On the other hand, it is necessary
to stress that auto-calibration function brings another degree of freedom into
the Search/Match process and thus decreasing the discrimination of present
phases and potential candidate phases.
Progress Search/Match Algorithm
For some cases of the Search/Match analysis, an alternative “Progress S/M” algorithm can be used. It is not as robust as the standard algorithm, but reveals increased power in search/matching under certain circumstances. The principle of this algorithm is more or less the same as the standard algorithm described above except that the calculation and interpretation of criterial functions differ.
Criterial functions for the progress algorithm are described below:
Let ![]() represents
the residual of observed and standard peak position (in 2Q units) of i-th reflection from the 10 strongest.
represents
the residual of observed and standard peak position (in 2Q units) of i-th reflection from the 10 strongest.
1. for ![]()
U = ![]()
Uext = ![]()
![]()
![]()
![]()
Ulim = 10-1
Qlim = 1.5
Dlim = 0.16 in 2Q units
2. for D > Dlim
Upen = ![]()
Uext = 0
Ulow = 10
Qlow = 10-3
3. The total criterial function is
Utot = U + Uext + Upen
Sharp Residual S/M
For the trace Search/Match procedure – called in the program “sharp residual S/M” – the same criterial functions are used as for the “progress” algorithm, but the parameters are set as follows:
Dlim = 0.16, Ulim = 0.5, Qlim = 10-12, Ulow = 20, Qlow = 10-8, Uext = 0, Ii = Ji
Peak Finding Algorithm
Evaluation of diffraction data proceeds in several steps. These are:
· Finding the peak positions and gross peak heights in the original powder pattern,
· calculation and optimization of the background curve, and
· calculation of net peak heights (height intensities) applying the correction for background level to gross peak heights.
· Optionally, peaks due to Ka2 may be removed.
1) Peak finding
·
Each powder pattern with a step size > 0.01° is interpolated by a cubic
spline function to a pattern with step size 0.01° (if the step size is less
than 0.01° the data are used without modification).
· The standardized pattern is smoothed employing the three-member Pascal smoothing function. The number of repeats of this procedure is inversely proportional to the value of the Resolution parameter.
·
After smoothing, the standardized pattern first
derivative is calculated. The resulting curve is again smoothed using the
three-member Pascal smoothing function. 
· Then the second derivative is calculated (A). From the resulting curve, the portion corresponding to negative values is converted to absolute values (B). From this curve, the third (C) and fourth derivatives (D) are calculated and steps between the curve are smoothed.
|
A |
|
B |
|
|
C |
|
D |
|
· The integral of fourth derivative curve in the range where function has positive values is compared to the Sensitivity parameter and thus the limit for accepting/rejecting the signal level as a peak is set.
· Discrete peak positions and intensities can be then tested for Ka2 peak presence and peaks corresponding to Ka2 (occurring at high angles) may be optionally removed.
2) Background calculation
· The pattern for which the background is to be evaluated is heavily smoothed employing a three-member Pascal smoothing function. The new pattern is created from the smoothed original data such that approximately each [1/(10 × Stepsize)]-th point of the pattern is sampled.
· The first derivative of this pattern is calculated with a range of N points where N is proportional to the Background parameter.
· Points with a value of the first derivative lower than a critical value of the Background parameter are defined as points to be taken into account for the first rough background curve estimate.
· An equidistant step size and an identical number of data points to the original powder pattern are realized by applying a cubic spline interpolation.
3) Net peak heights
are calculated from the gross peak heights obtained in the first step, applying
the correction for background level.