Description of Algorithm for Analysis and 3D Reconstruction of Living Cell Inner Structures from High-Resolution Bright-Field Microscopy Images
T. Náhlík, R. Rychtáriková, D. Štys
University of South Bohemia in Ceske Budejovice, Faculty of Fisheries and Protection of Waters, South Bohemian Research Center of Aquaculture and Biodiversity of Hydrocenoses, Institute of Complex Systems, Zámek 136, 373 33 Nové Hrady, Czech Republic
nahlik@frov.jcu.cz
Bright-field microscopy images provide us the best information about the cell and cell interior without any labelling or other changes of the sample.
The first step in our analysis is the calculation of PDG (Point Divergence Gain) [1]. The basic idea of this analysis is that homogeneous objects give the PDG values (information change between two consecutive images in Z-scan) equal zero. Therefore, the second step is selection of all these points. This images are applied as a mask on the original images. Now we are able to do the first 3D reconstructions. The zero value of the PDG does not mean that these objects will have the same intensities in the whole volume.
In the bright-field microscopy (diffraction images) the focused objects are the darkest ones. To obtain the image of the real object, the next logical step is to find layers with the same intensity. This is performed by finding contours in z-stack images (Fig. 1).
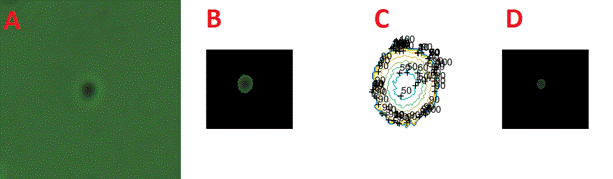
Figure 1. Demonstration of the algorithm on the image of 220nm latex particle. A - Original image, B - Part of the image with zero values of PDG, C – Contour image with different intensities, D – Darkest part of the image.
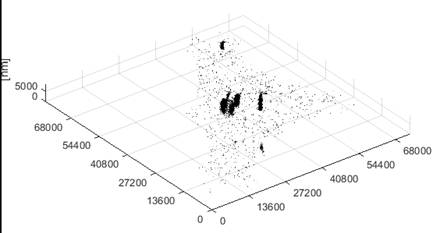
Figure 2. 3D reconstruction of the cell. PDG values are equal to zero – 3D view.
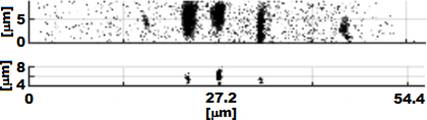
Figure 3. 3D reconstruction of the cell. PDG values equal to zero (top) and their darkest parts (bottom) – side view.
This PDG analysis is used for estimation of the cell size and will be followed by analysis of differential images. Differential images gives us more precise and more localized information about individual organelles and primitive diffracting objects (Figs. 2, 3).
Differential images can be also used for detection of the cell (Fig. 4).
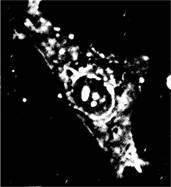

Figure 4. Left image – Sum of images with lower intensities, Right image – final mask of the cell
1. R. Rychtáriková, T. Náhlík, R. Smaha, J. Urban, D. Štys Jr., P. Císař, D. Štys, in ISCS 2014:Interdisciplinary Symposium on Complex Systems (Emergence, Complexity and Computation 14), edited by A. Sanayei, O.E. Rössler, I. Zelinka (Switzerland: Springer), 2014, pp. 261-267.
This work was financially supported by Postdok JU CZ.1.07/2.3.00/30.0006, by the GAJU 134/2013/Z, and by the Ministry of Education, Youth and Sports of the Czech Republic projects CENAKVA (No. CZ.1.05/2.1.00/01.0024) and CENAKVA II (No. LO1205 under the NPU I program).