Raman and infrared spectroscopy of amino acids and its implication for improvement of the protein secondary structure determination
T. Pazderka1, V. Kopecký Jr.1, K. Hofbauerová1,2, V.
Baumruk1
1Institute of Physics, Faculty of Mathematics and Physics, Charles University in Prague, Ke Karlovu 5, Prague 2, CZ-121 16, Czech Republic; pazderka@karlov.mff.cuni.cz
2Institute of Microbiology, Academy of Sciences, Vídeňská 1083, Prague 4, CZ-142 20, Czech Republic
Determination of the protein structure represents one of the key tasks of present molecular biology. Raman and infrared (FTIR) spectroscopy can provide good wealth of information about protein structure in comparison to other methods of optical spectroscopy. Therefore, development and improvement in such spectroscopic techniques that can be used for characterization of proteins is becoming increasingly important in the rapidly expanding field of proteomics.
In this study Raman and FTIR spectra of all amino acids (AA) presented in proteins have been measured with a view to possible protein sequence dependent subtraction of vibration bands of AA side chains in the regions of amide I, II and III. The measurements were especially focused on new method of non-enhanced Raman spectroscopy – the drop coating deposition Raman (DCDR) spectroscopy [1] – based on a coffee ring effect, which enables measurements of solutions with concentration of biomolecules down to ca. 0.01 mg/mL. Even if the DCDR measurements are a bit of problematic [2] good quality spectra of molecules in glass phase can be obtained [3]. The Raman measurements were performed on extremely diluted amino acid samples (0.005 mg/mL) – where coffee ring effect doesn't play a role – to avoid formation of microcrystals. The method of AA side chains spectral subtraction was tested on short peptide samples with known primary sequence. The influence of the subtraction on improvement of the secondary structure determination is discussed as well.
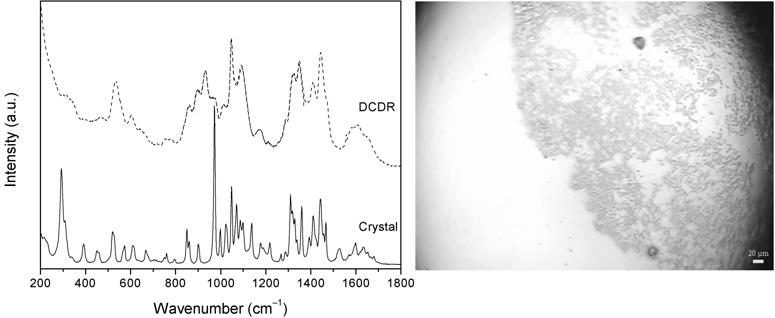
Fig. 1. – (left) Raman spectra of L-arginine measured from the polycrystalline sample and as DCDR deposit and (right) the detail view of DCDR deposited sample, whereas the white bar in the photography represents 20 µm.
[1] D. Zhang, Y. Xie, M. F. Mrozek et al., Anal. Chem., 75 (2003) 5703–5709.
[2] V. Kopecký Jr., V. Baumruk, Vib. Spectrosc., 42 (2006) 184–187.
[3] J. Kapitán J., V. Baumruk, V. Kopecký Jr. et al., J. Am. Chem. Soc., 128 (2006) 13451–13462.
The Grant Agency of the Academy of Sciences and the Charles University in Prague are acknowledged for the support (Nos. KJB101120805, SVV-2010-261304 and SVV-2011-263304).