<fm><atl>High Throughput Powder Diffraction – New Methods to
Characterise Large Datasets</atl>
<aug><au><fnm><au><fnm></fnm><snm></fnm><snm></snm></au><orf id=""><cor email="chris@chem.gla.ac.uk"></cor></snm></au><orf id=""><au><fnm></fnm><snm></snm></au><orf id="">
<aff><oid id="">Department of
Chemistry, University of Glasgow, Glasgow G12 8QQ, Scotland, <cny>UK</cny></aff></aug>.
Contact E-mail: gbarr@chem.gla.ac.uk
With modern robotic systems and data collection methods, it is quite possible to measure 1000 powder diffraction patterns in a few days, and such volumes of data are becoming commonplace in pharmaceutical laboratories where the search for polymorphs and salts is of great importance. The problem arises as to what to do with such volumes of data; in particular how it can be meaningfully analysed, and how it can be grouped into classes when there is no reference database of pure phases? We have developed two computer programs to address these issues [1, 2] that use statistical techniques of multivariate analysis and classification to solve these problems. The formalism works as follows:
1.
Full profile data are optionally pre-processed with background removal,
smoothing via wavelets, and peak searching.
2.
Each of the n patterns is correlated with every other pattern
using the Pearson and Spearman coefficients to generate an (n´ n) correlation
matrix.
3.
This is used to generate a distance matrix which acts as a source of
classification to generate dendrograms, multidimensional metric scaling,
silhouettes, fuzzy clusters and minimum spanning trees; these are tools that
can partition the data into clusters of related patterns. A typical dendrogram
is show in Figure 1.
|
|
|
|
Figure 1 |
Figure 2 |
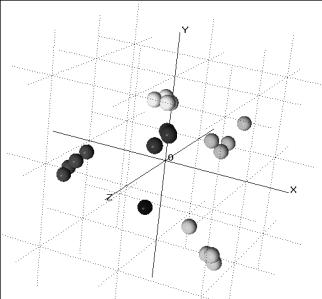
Here we have partitioned 21 patterns into 6 clusters containing between 1 and 4 patterns. You can also represent the data in three dimensions using multidimensional metric scaling (Figure 2). Every sphere represents a powder pattern.
Several other visualisation tools can also be utilised. Additionally, in the presence of a database of pure phases quantitative analysis of mixture patterns may be carried out using the full diffraction pattern and singular value decomposition-based analysis techniques.
[1] Gilmore, C.J., Barr, G. & Paisley, J. (2004). J. Appl. Cryst. 37, 231-242.
[2] Barr, G. Dong, W. & Gilmore, C.J., (2004). J. Appl. Cryst. 37, 243-252.