Ab initio structure determination of two anhydrous forms of a-lactose by powder X-ray diffraction
C.
Platteau, J. Lefebvre, S. Hemon, F. Affouard, J.F. Willart and P.
Derollez
Laboratoire de
Dynamique et Structure des Matériaux Moléculaires (UMR CNRS 8024), Bâtiment P5,
Université des Sciences et Technologies de Lille, 59655 Villeneuve d’Ascq
Cédex, France.
Lactose, a milk
sugar, fixes the molecules of water, which permits to increase the duration of
preservation of a product. Consequently, lactose is of great interest for food
and pharmaceutical industries. Lactose (4-O-b-d-galactopyranosyl-d-glucopyranose), is a ‘mixed’
disaccharide containing a galactose and a glucose unit linked through a b–1,4 linkage. It exhibits two anomers (a–lactose and b–lactose) which differ in the
configuration of the terminal hydroxyl group of the glucose unit. For the a–anomer, three crystalline forms have been
characterised [1] : the a–lactose monohydrate (hereafter
named aL-H2O), the hygroscopic
anhydrous a–lactose (aLH) and the stable
anhydrous a–lactose (aLS). The b–anomer has only one crystalline form (bL); mixed compounds a-b-lactose have also been identified
with different stoechiometries (a/bL) [2], [3]. The crystalline structures of the aL-H2O form [4], [5], [6] and bL form [7] were solved from single crystal samples with an
automatic X-ray diffractometer.
The aim of this
abstract is to explain the ab initio structure determination of two
anhydrous forms of a-lactose
by powder X-ray diffraction:
the aLH form and the stable anhydrous
phase of a–lactose. The reason why we did it
on powder is given for each phase in the next parts. We have followed the same
procedure for the two phases:
1) The data
were collected on the laboratory diffractometer equipped with an INEL curved
sensitive detector CPS120. A bent quartz monochromator allows to select the Ka1 wavelength of a Cu X-ray tube (l = 1.54056 Å). The powder was introduced
in a Lindemann glass capillary (diameter = 0.7mm), mounted on the axis of the
diffractometer. It was rotated during the experiment in order to reduce the
effect of possible preferential orientations.
2) The profiles of n reflections were individually refined with the program Winplotr [8] in order to obtain their exact 2q positions. We used then the program TREOR [9] to index the reflections. A part of the X-ray diffraction pattern was refined with the cell found by TREOR and using the “profile matching” option [10] of the program FullProf [11], in order to determine the space group.
3) Lattice and profile parameters, zero point and interpolated background calculated with the previous refinements were introduced in the program F.O.X. [12] in order to get a starting structural model. The “parallel tempering” algorithm of this program was used.
4) The final
structure was obtained through Rietveld refinements with soft restraints on
interatomic bond lengths and bond angles (program Fullprof [11]) and crystalline energy
minimisation to locate the H atoms of the hydroxyl groups.
The results
are the following :
1. the hygroscopic
anhydrous phase of a–lactose
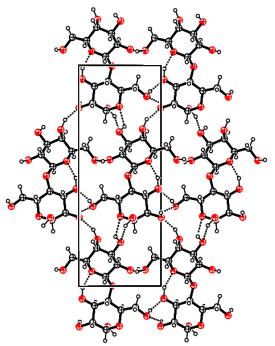
a-lactose monohydrate annealed at 135°C allowed to get a mixture of this compound with hygroscopic anhydrous a–lactose. A powder X-ray diffraction pattern of this mixture was recorded at room temperature. To determine the lattice parameters of the phases, the profiles of the 58 reflections with a 2q angle lower than 40° were refined with the program Winplotr. Among the 58, 44 reflections were attributed to the aL-H2O form but 14 of them ranging from 9 to 33° do not belong, unambiguously, to the aL-H2O phase. Having isolated the aLH phase, we could continue the procedure as described beforehand. We have found a monoclinic symmetry, a space group P21 with 2 molecules per cell (Z’ = 1), and the following lattice parameters: a = 7.7795 (3), b = 19.6931 (7), c = 4.9064 (1) Å, b = 103.691 (2)°, V = 730.32 (4) Å3. The final Rietveld plot is given on figure 1a (Rp=0.0657, Rwp=0.0733, Rexp=0.0222, c2=10.9). The crystalline cohesion is achieved by networks of O–H···O hydrogen bonds (figure 1b). The width of the Bragg peaks is interpreted by a phenomenological microstructural approach in terms of isotropic size effects and anisotropic strain effects.
2. the stable
anhydrous phase of a–lactose.
The stable
anhydrous a–lactose (aLS) form, not
commercially available, can be obtained from aL-H2O either by heating
at about 140°C or by dehydration in an hygroscopic solvent such as methanol [13], which we have used. To get single crystals to perform
X-ray experiments with an automatic diffractometer, the aLS powder must be dissolved in a
solvent and, then, crystals grow either by temperature lowering or by
evaporation. In solution, the molecule of lactose can undergo hydration to form
aL-H2O or mutarotation to form bL. For this reason, the structure of the aLS form was solved ab initio
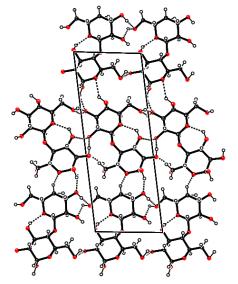
from powder X-ray pattern using the Rietveld method. We have found a triclinic symmetry, a space group P1 with 2 molecules per
cell, and the following lattice parameters: a = 7.6522 (2), b = 19.8637 (5), c
= 4.9877 (1) Å, a = 92.028 (1)°, b = 106.261 (1)°, g = 97.153 (1)°, V = 720.18 (4) Å3.
The final Rietveld plot is
given on figure 2a. (Rp=0.0555, Rwp=0.0624, Rexp=0.0159, c2=15.5). The crystalline
cohesion is achieved by networks of O–H···O hydrogen bonds different to those
of the aL-H2O and aLH phases (figure2b).
The broadening of the Bragg
reflections is interpreted in terms of size of the crystallites and of strain
of the lattice.
|
|
|
|
a) |
b) |
|
Figure
1: (a) Final
Rietveld plot of the hygroscopic phase of a-lactose. Observed data points are
indicated by dots, the best-fit profile (upper trace) and the difference
pattern (lower trace) are solid lines. The vertical bars correspond to the
position of Bragg peaks: upper bars for aLH, lower bars for aL-H2O. (b) Projection of
the unit cell of the hygroscopic a-lactose along c*. Dashed lines
correspond to H bonds |
|
|
|
|
|
a) |
b) |
|
Figure
2: (a)
Final Rietveld plot of the stable anhydrous phase of a–lactose. Observed data points are
indicated by dots, the best fit profile (upper trace) and the difference
pattern (lower trace) are solid lines. The vertical bars correspond to the
position of Bragg peaks. (b) Projection along c* of the unit cell of
the stable anhydrous form of a-lactose. Dashed lines correspond
to H bonds. |
|
[1] Garnier,
S. (2001), Thesis, University of Rouen, (France)
[2] Burshill, J. H., Wright, W. B., Fuller, H. F. &
Bell, A. V. (1965) J. Sci. Food Agric. 16,
622-628
[3] Lerk, C. F.,
Andreae, A. C., Boer, A. H. de, Hoog, P. de, Kussendrager, K. & Leverink, J. van (1984). J. Pharm. Sci. 73, 856-857.
[4] Fries,
D. C., Rao, S. T. & Sundaralingam, M. (1971). Acta Cryst. B27, 994-1005.
[5] Beevers, C.
A. & Hansen, H. N. (1971). Acta Cryst. B27, 1323-1325.
[6] Noordik, J.
H., Beurskens, P. T., Bennema, P., Visser, R. A. & Gould, R. O. (1984). Z. Kristallogr. 168, 59-65.
[7]
Hirotsu, K. & Shimada, A. (1974). Bull. Chem. Soc. Japan 47,
1872-1879.
[8] Roisnel, T.
& Rodriguez-Carvajal, J. (2002). Mater. Sci. Forum 378-381,
118-123.
[9] Werner, P.
E., Eriksson, L. & Westdahl, M. (1985). J. Appl. Cryst. 18, 367-370.
[10] Le Bail,
A., Duroy, H. & Fourquet, J. L. (1988). Mater. Res. Bull. 23, 447-452.
[11]
Rodriguez-Carvajal, J. (2001). FullProf, version 1.9c, LLB, CEA/Saclay, France.
[12]
Favre-Nicolin, V. & Cerny, R. (2002). J. Appl. Cryst. 35, 734-743. [8] Kreveld, A. van (1969). Neth.
Milk Dairy J. 23, 258-275.
[13] Kreveld, A.
van (1969). Neth. Milk Dairy J. 23, 258-275.