ABSORPTION SPECTRUM OF CALCIUM TARTARIC AND CADMIUM OXALATE CRYSTALS GROWN IN GEL AND DOPED BY CHROMIUM, COBALT AND NICKEL ATOMS
Konstantin Popov
Department of Physics,
Syktyvkar State University, 55 Octyabrsky pr., 167001 Syktyvkar,
Russia,
E-mail: popov@ssu.edu.komi.ru
Studding of the processes of crystal growth in gel put before the investigators a number of problems, connected with the structural and physical properties of obtained crystals. This work is devoted to admixtures implantation to crystal during its growth in gel and their influence on the optical properties of obtained crystals. The crystals of Tetra-hydrate Calcium Tartaric (CaC4Í4O6 *4H2O) (CO) and Dehydrate Cadmium Oxalate (CdC2O4*2H2O) (CO) were choose as the objects of investigation. Those metal-organic crystals practically do not dissolve in water, transparent and can serve the convenient objects for investigation of different phenomena during crystal nucleation and growth. The technology of crystal growth in gel, described in [1], was used with some modifications. In this work we made an attempt to bring in the ions of some atoms (Ni, Cr, Co) to the structure of TC and OC during their growth in gel. This procedure course to change of the optical properties of crystals, in particular to change of their color. Measured optical spectrum of absorption let us discuss about quantitative changes of extinction of grown up crystals.
The results of measurement of admixture atom concentration in studded crystals are introduced in tables 1 and 2. It is necessary to note that unavoidable attendance of Sodium atoms in all tip of crystals is a result of our technology of gel preparation. At that, the crystals of CT contain the number of Sodium atoms some times smaller then CO. There were detected a considerable amount of explored metals only while penetrating of Nickel atoms to CT and CO and in the case of Chrome in CT. In the other variants measured concentrations were on phone level. But it is appear that there were inough atoms to change the crystal color..
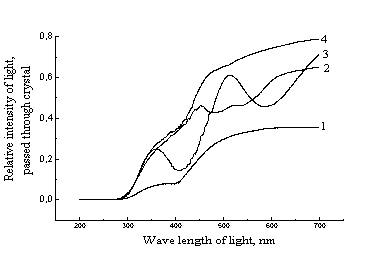
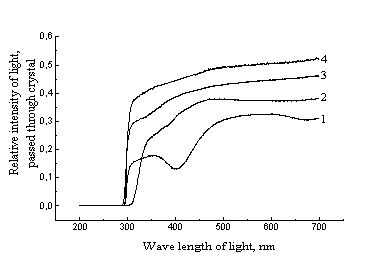
Absorption spectrums of light by CT and CO crystals, doped by strange metals are introduced on the Fig.1 and 2. There are also exists the spectrums of admixture free CT and CO. It's appear that both tip of crystals are not transparent for wave length below 300 nm.
Despite of relatively high content of Nickel in CT crystals it influenced only on general change of absorption with conserve of spectrum character. In the case of CO Nickel atoms provided the sharp absorption band in the region of 400 nm and smooth decreasing of pass through for wave length higher then 600 nm, which color the crystals in to yellow-green. In both tip of crystals Ni doping course to the maximum general extinction.
Addition of Chromium to CO by used method did not provide its considerable concentration in crystals, did not change the color and small influence on the character of spectrum. The opposite effect is noticed in the case of CT doping by Cr, which concentration reached a relatively high value. There are two deep absorption holes at 400 nm and 600 nm that make green the color of obtained crystals.
Concentration of Cobalt atoms both in CT and CO was small, but it was high enough to change the optical properties of crystals. We can see the wide and deep absorption band from 450 nm to 600 nm in spectrum of CT, which color become brown. Spectrums of CO have a long slump from 450 nm in to red region that course to appearance of a lilac color of crystals.
Table 1.
Concentrations of metals in Calcium Tartaric crystals
| No. | Name of admixture | Na | Ni | Co | Cr | Color of crystal |
| (mg/kg) | (mg/kg) | (mg/kg) | (mg/kg) | |||
| 1 | NiSO4 | 670 | 300 | 2.0 | 5.9 | yellow |
| 2 | Co(NO3)2 | 350 | 3.8 | 5.9 | 3.0 | brown |
| 3 | CrCl2 | 1300 | 1.7 | 3.0 | 180 | green |
| 4 | free of admixture | 440 | 2.8 | 4.0 | 7.0 | yellow |
Table 2..
Concentrations of metals in Cadmium Oxalate crystals.
| No. | Name of admixture | Na | Ni | Co | Cr | Color of crystal |
| (mg/kg) | (mg/kg) | (mg/kg) | (mg/kg) | |||
| 1 | NiSO4 | 4000 | 150 | 8.0 | 6.0 | yellow-green |
| 2 | Co(NO3)2 | 670 | 2.0 | 8.0 | 0.6 | lilac |
| 3 | CrCl2 | 3200 | 3.8 | 8.0 | 3.8 | colorless |
| 4 | free of admixture | 2600 | 2.9 | 3.0 | 3.3 | colorless |
|
|
| Fig.1. Absorption spectrum of Calcium Tartaric doped by metals: 1. Nickel; 2. Cobalt; 3. Chromium; 4. Free of admixture. | Fig.2. Absorption spectrum of Cadmium Oxalate doped by metals: 1. Nickel; 2. Cobalt; 3. Chromium; 4. Free of admixture. |